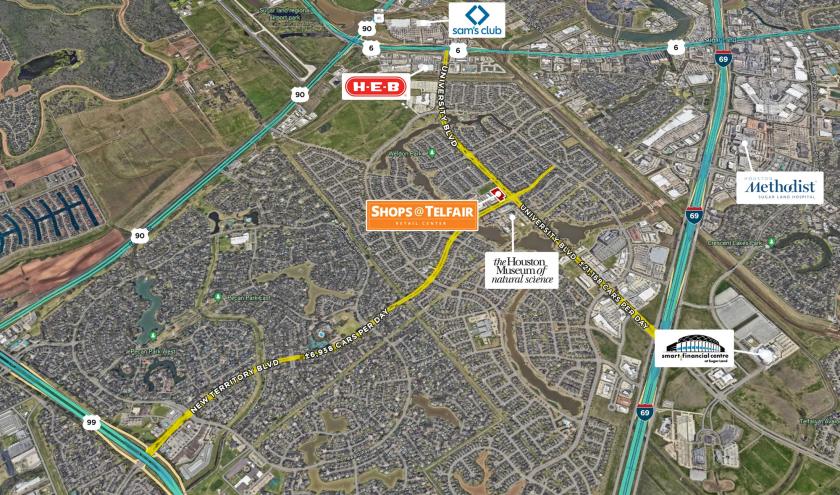
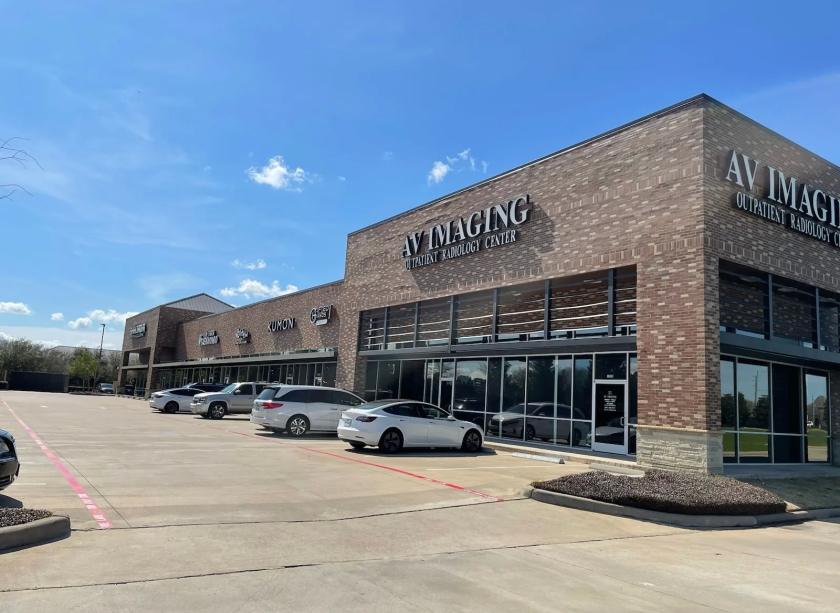
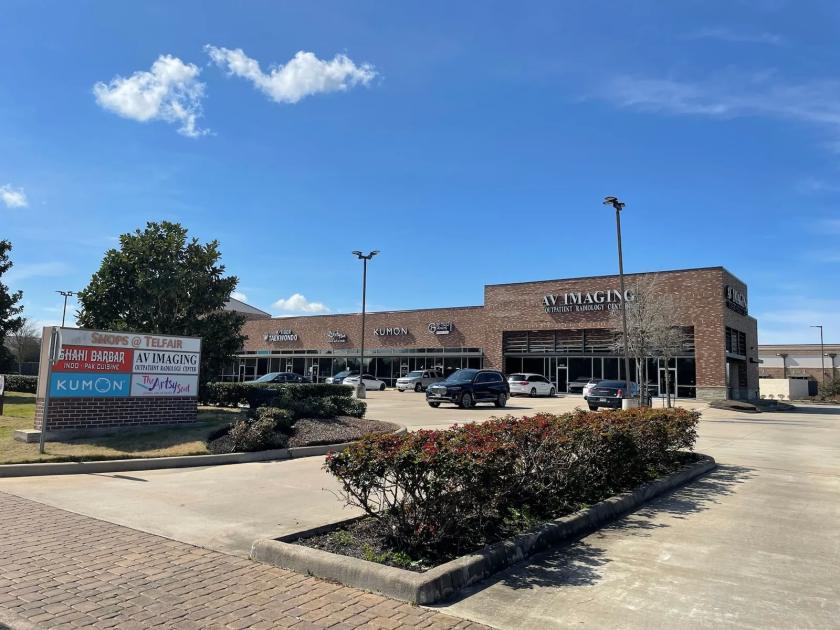
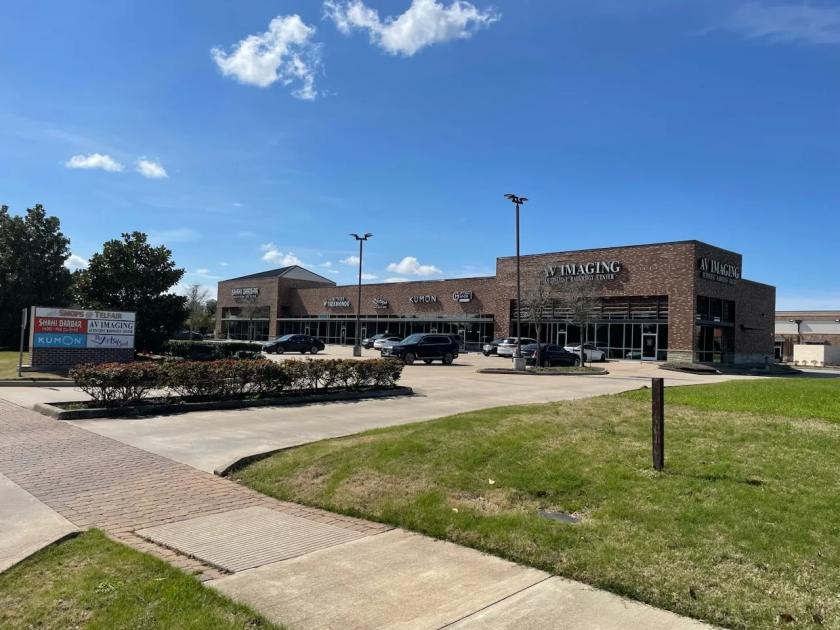
Retail Space
12920 University Boulevard Sugar Land, TX 77479
12920 University Boulevard Sugar Land, TX 77479
Details & Description
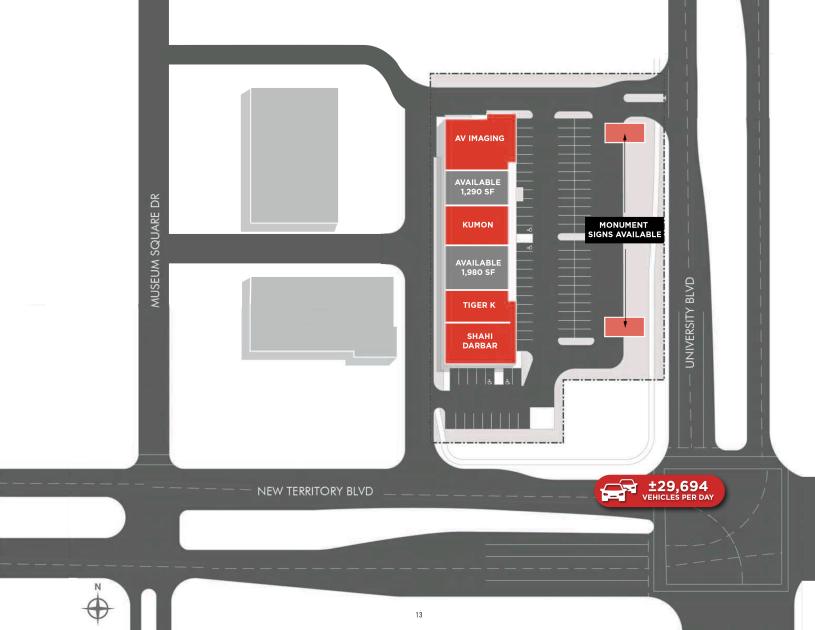
Property Highlights
- • Ready For Immediate Occupancy
- • Ample surface parking
- • Multiple Ingress/Egress Access Points
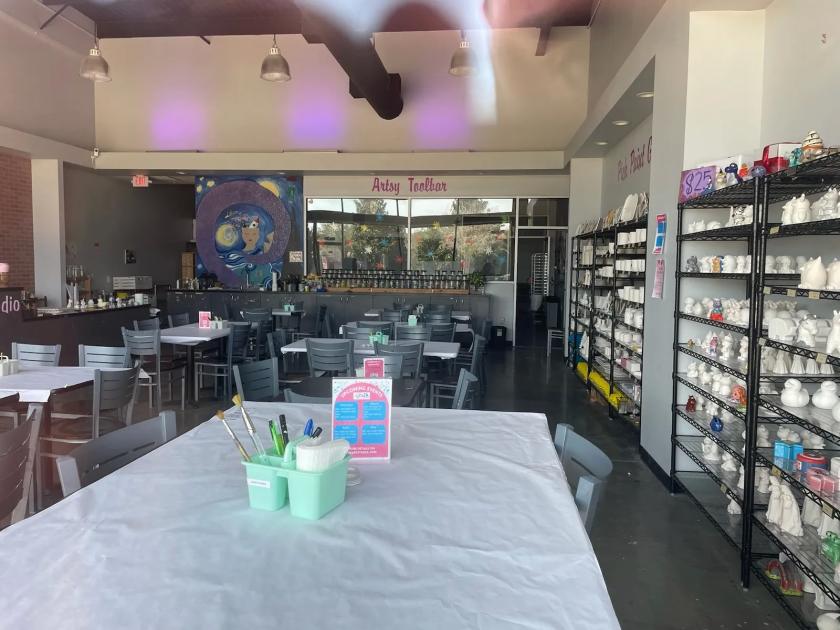
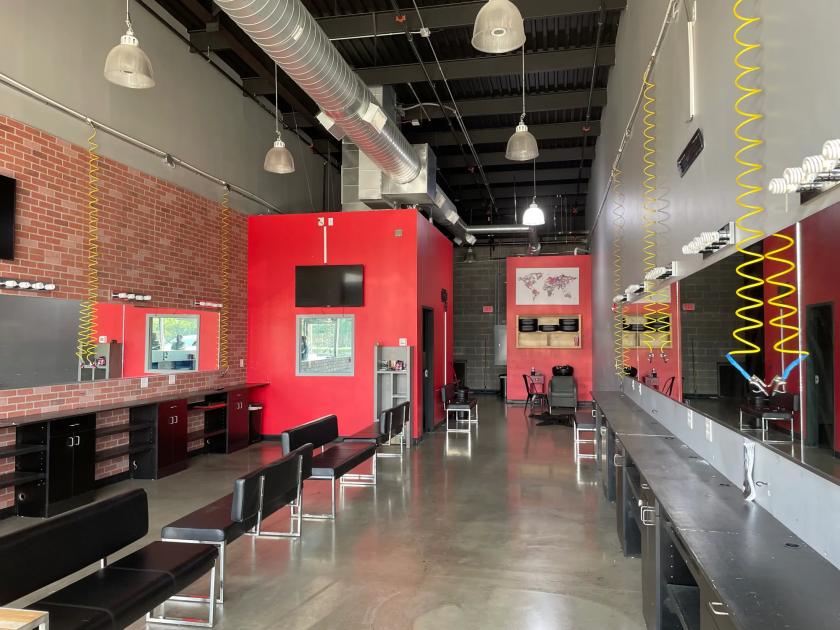
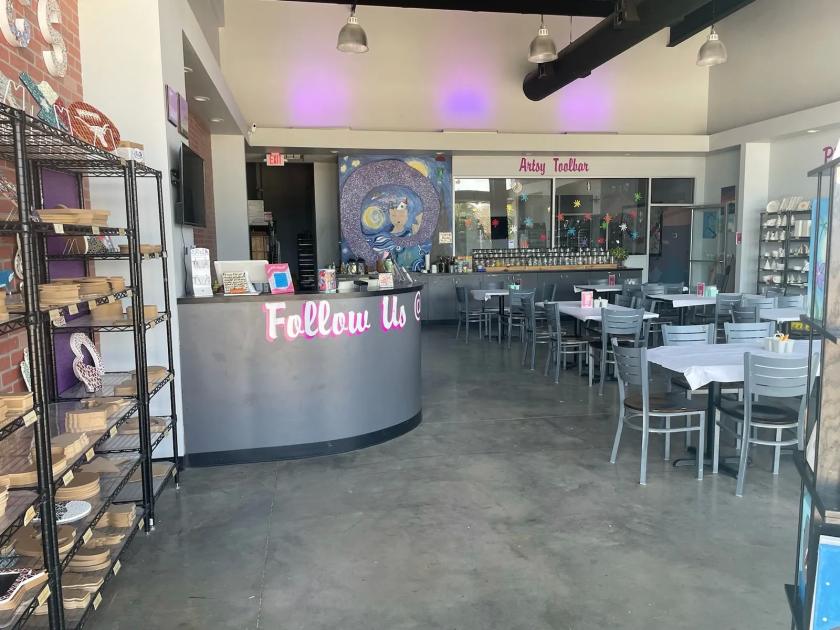
Additional Photos

Listing Agents

Jacob Grossman
O: 713-325-5207
jacob.grossman@freg.com
O: 713-325-5207
jacob.grossman@freg.com

Nick Jasien
O: 713-325-5208
nick.jasien@freg.com
O: 713-325-5208
nick.jasien@freg.com
While we strive to provide the most accurate information, all listing information, and demographic data, is provided by third-parties. As such, MyEListing will not be responsible for the accuracy of the information. It is strongly recommended that you verify all information with the listing agent, and any relevant agencies, prior to making any decisions.