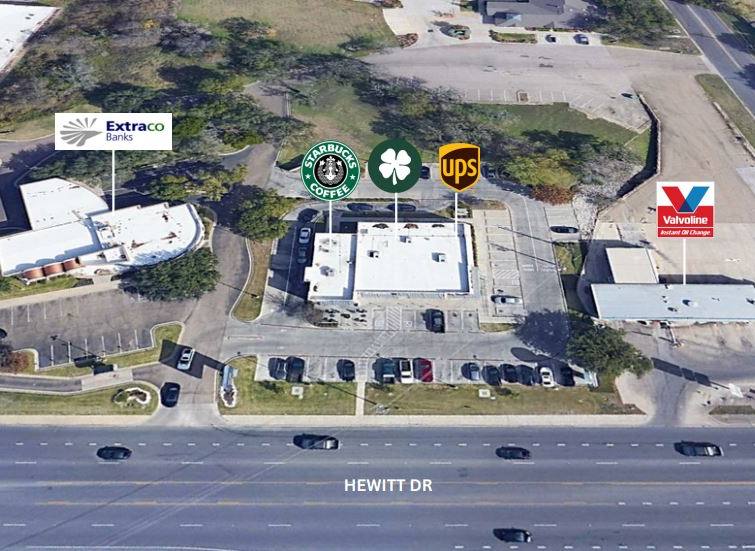
1-Mile | 3-Miles | 5-Miles | ||
---|---|---|---|---|
Total Population | 6,042 | 36,604 | 87,168 | |
Population Median Age | 38 | 39 | 38 | |
Population by Age | 0-9 Yrs | 994 (16%) | 5137 (14%) | 12320 (14%) |
10-19 Yrs | 950 (15%) | 4619 (12%) | 11702 (13%) | |
20-29 Yrs | 556 (9%) | 4970 (13%) | 12697 (14%) | |
30-39 Yrs | 844 (13%) | 5174 (14%) | 11911 (13%) | |
40-49 Yrs | 495 (8%) | 3526 (9%) | 9050 (10%) | |
50-59 Yrs | 579 (9%) | 4384 (11%) | 10402 (11%) | |
60-69 Yrs | 717 (11%) | 3861 (10%) | 9057 (10%) | |
70+ Yrs | 907 (15%) | 4932 (13%) | 10029 (11%) | |
Median HH Income | $82,747 | $64,366 | $58,685 | |
Total Household Income | < 24K | 243 (11%) | 2420 (17%) | 6264 (18%) |
25-49K | 334 (15%) | 2916 (20%) | 7996 (24%) | |
50-74K | 387 (18%) | 2708 (19%) | 5360 (16%) | |
75-99K | 281 (13%) | 2043 (14%) | 4574 (13%) | |
100-199K | 586 (27%) | 3165 (22%) | 6958 (21%) | |
200K+ | 271 (12%) | 907 (6%) | 1877 (5%) | |
Highest Education Level | No Diploma | 184 | 1805 | 6493 |
Diploma or GED | 540 | 4887 | 13144 | |
Some College | 895 | 5971 | 13073 | |
Assoc. Degree | 328 | 2374 | 5550 | |
Bachelors Degree | 1228 | 6025 | 11984 | |
Higher Degree | 757 | 3677 | 7252 | |
Total Housing Units | 2,190 | 15,637 | 36,121 | |
--Owner-Occupied | 1,377 | 8,075 | 19,915 | |
--Renter-Occupied | 724 | 6,084 | 13,113 | |
Owner-Occupied Values | < 100K | 14 | 750 | 4320 |
100-199K | 529 | 3492 | 7818 | |
200-299K | 658 | 2583 | 4947 | |
300-399K | 112 | 633 | 1549 | |
400-499K | 34 | 289 | 588 | |
500K+ | 29 | 328 | 693 | |
Total Working Age Population | 4,282 | 28,194 | 66,905 | |
In Work Force | 2,582 | 18,380 | 43,828 | |
Not In Work Force | 1,700 | 9,814 | 23,076 | |
Workforce Employed | 2,502 | 17,684 | 42,071 | |
Workforce Unemployed | 80 | 690 | 1,722 | |
Civlian Workforce | 2,582 | 18,374 | 43,792 | |
Military Workforce | 0 | 5 | 36 | |
Total Households | 2,102 | 14,159 | 33,028 | |
Family Households | 1,507 | 9,381 | 22,131 | |
Non-Family Households | 595 | 4,778 | 10,898 | |
Married Couple | 1,224 | 6,882 | 16,293 | |
Other Family | 282 | 2,499 | 5,838 | |
Married w/Child | 626 | 2,549 | 6,447 | |
Single Male w/Child | 24 | 195 | 540 | |
Single Female w/Child | 132 | 1,334 | 2,625 |
Population Change Last Two Decades - Plus Projection
2000 | % | 2010 | % | 2020 | % | 2030 | |
---|---|---|---|---|---|---|---|
Texas | 20,851,820 | +21 | 25,145,561 | +18 | 29,677,668 | +18 | 34,894,452 |
McLennan County | 213,517 | +10 | 234,906 | +8 | 253,066 | +6 | 269,381 |
Total Working Age Population:
Total Households:
Total Working Age Population:
Total Households:
Total Working Age Population:
Total Households: