Retail Space
9521 Fields Ertel Road Loveland, OH 45140
9521 Fields Ertel Road Loveland, OH 45140

Details & Description
Property Highlights
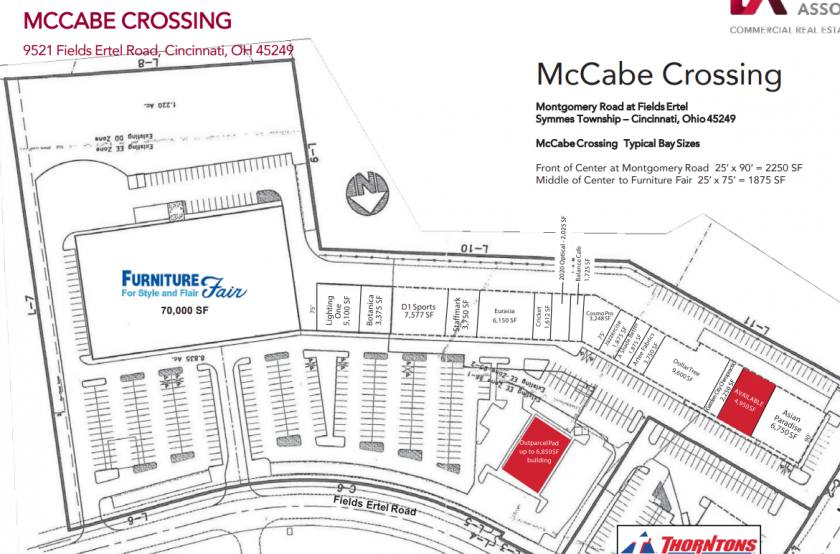
• Seeking apparel, shoes, toys, housewares, sporting goods, printing, paint, bakery, tanning, hair salons, etc.
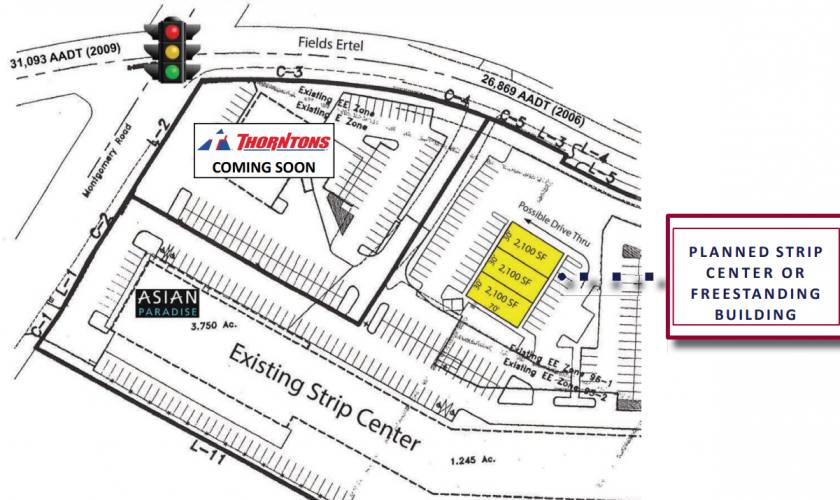
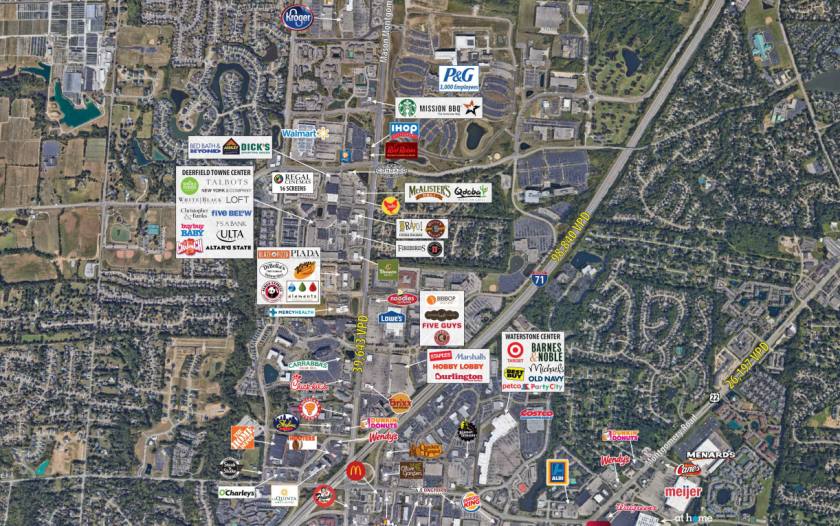
• Furniture Fair anchored center at corner traffic light intersection across from Meijer and Sam’s Club
Additional Photos

Listing Agents

John Thompson
O: 513-588-1842
M: 513-703-2500
jthompson@lee-associates.com
O: 513-588-1842
M: 513-703-2500
jthompson@lee-associates.com

TC Bartoszek
O: 513-588-1840
M: 513-535-0563
tcbartoszek@lee-associates.com
O: 513-588-1840
M: 513-535-0563
tcbartoszek@lee-associates.com

Molly Hoffman
O: 513-588-1843
mhoffman@lee-associates.com
O: 513-588-1843
mhoffman@lee-associates.com
While we strive to provide the most accurate information, all listing information, and demographic data, is provided by third-parties. As such, MyEListing will not be responsible for the accuracy of the information. It is strongly recommended that you verify all information with the listing agent, and any relevant agencies, prior to making any decisions.


