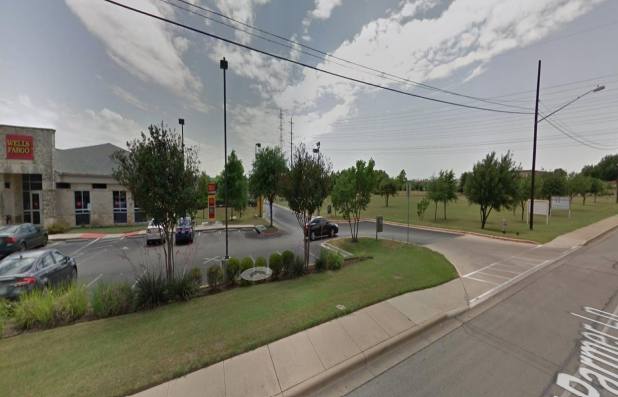
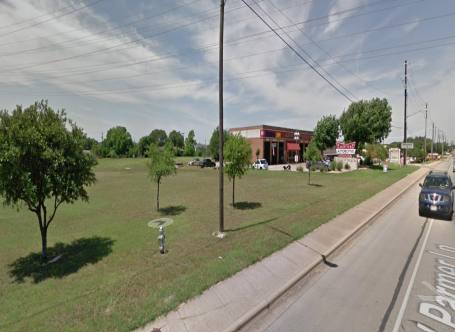
1-Mile | 3-Miles | 5-Miles | ||
---|---|---|---|---|
Total Population | 13,853 | 117,813 | 296,431 | |
Population Median Age | 37 | 35 | 35 | |
Population by Age | 0-9 Yrs | 1745 (12%) | 15287 (12%) | 38642 (13%) |
10-19 Yrs | 701 (5%) | 10928 (9%) | 32196 (10%) | |
20-29 Yrs | 2647 (19%) | 22324 (18%) | 50252 (16%) | |
30-39 Yrs | 3064 (22%) | 25325 (21%) | 62085 (20%) | |
40-49 Yrs | 1935 (13%) | 15586 (13%) | 40439 (13%) | |
50-59 Yrs | 1868 (13%) | 13169 (11%) | 32595 (10%) | |
60-69 Yrs | 1190 (8%) | 9601 (8%) | 23542 (7%) | |
70+ Yrs | 702 (5%) | 5592 (4%) | 16678 (5%) | |
Median HH Income | $70,067 | $69,014 | $68,265 | |
Total Household Income | < 24K | 580 (9%) | 6409 (12%) | 17616 (14%) |
25-49K | 1413 (22%) | 10344 (20%) | 24595 (20%) | |
50-74K | 1454 (22%) | 10883 (21%) | 24835 (20%) | |
75-99K | 1071 (16%) | 7737 (15%) | 17084 (13%) | |
100-199K | 1500 (23%) | 12735 (25%) | 30840 (25%) | |
200K+ | 307 (4%) | 2317 (4%) | 7167 (5%) | |
Highest Education Level | No Diploma | 707 | 7710 | 23363 |
Diploma or GED | 1608 | 15558 | 39018 | |
Some College | 2287 | 15987 | 38608 | |
Assoc. Degree | 506 | 5504 | 12577 | |
Bachelors Degree | 3610 | 26541 | 62341 | |
Higher Degree | 2070 | 13282 | 33040 | |
Total Housing Units | 6,712 | 54,205 | 130,272 | |
--Owner-Occupied | 2,419 | 19,836 | 51,265 | |
--Renter-Occupied | 3,907 | 30,589 | 70,873 | |
Owner-Occupied Values | < 100K | 59 | 797 | 3067 |
100-199K | 508 | 4051 | 9825 | |
200-299K | 858 | 6932 | 17618 | |
300-399K | 563 | 5624 | 11021 | |
400-499K | 301 | 1656 | 5280 | |
500K+ | 130 | 776 | 4453 | |
Total Working Age Population | 11,646 | 95,422 | 237,865 | |
In Work Force | 8,813 | 73,556 | 179,622 | |
Not In Work Force | 2,833 | 21,866 | 58,243 | |
Workforce Employed | 8,410 | 70,490 | 171,294 | |
Workforce Unemployed | 383 | 3,027 | 8,230 | |
Civlian Workforce | 8,793 | 73,517 | 179,524 | |
Military Workforce | 20 | 39 | 98 | |
Total Households | 6,325 | 50,425 | 122,138 | |
Family Households | 2,932 | 26,451 | 66,111 | |
Non-Family Households | 3,393 | 23,974 | 56,027 | |
Married Couple | 2,250 | 18,879 | 47,395 | |
Other Family | 683 | 7,572 | 18,716 | |
Married w/Child | 1,019 | 8,326 | 22,303 | |
Single Male w/Child | 76 | 1,239 | 2,743 | |
Single Female w/Child | 204 | 2,745 | 6,978 |
Population Change Last Two Decades - Plus Projection
2000 | % | 2010 | % | 2020 | % | 2030 | |
---|---|---|---|---|---|---|---|
Texas | 20,851,820 | +21 | 25,145,561 | +18 | 29,677,668 | +18 | 34,894,452 |
Travis County | 812,280 | +26 | 1,024,266 | +26 | 1,291,502 | +19 | 1,540,812 |
Williamson County | 249,967 | +69 | 422,679 | +40 | 589,914 | +41 | 830,421 |
Total Working Age Population:
Total Households:
Total Working Age Population:
Total Households:
Total Working Age Population:
Total Households: