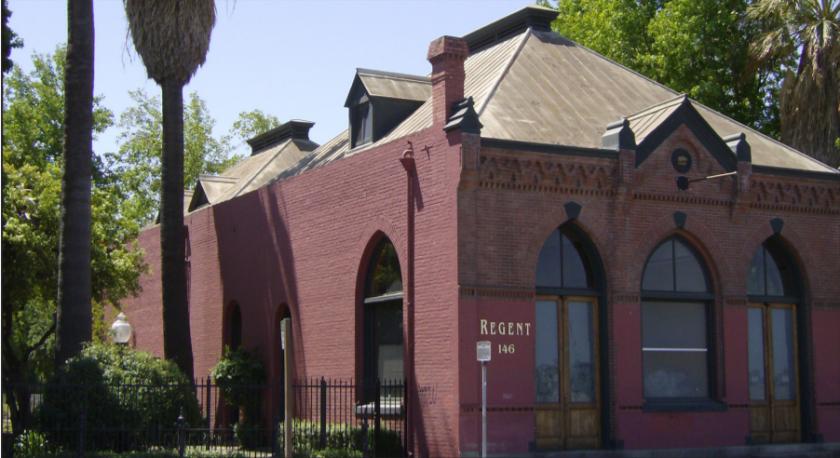
This beautiful historic property is ideal for many uses—law firms, professional offices,
counseling or program space, etc.
Office suites are available ranging from 2,310 SF to 5,000 SF (whole building).
The floor plan consists of a large reception area, seven private offices, kitchen/break
room, three restrooms, and an open area on the Mezzanine.
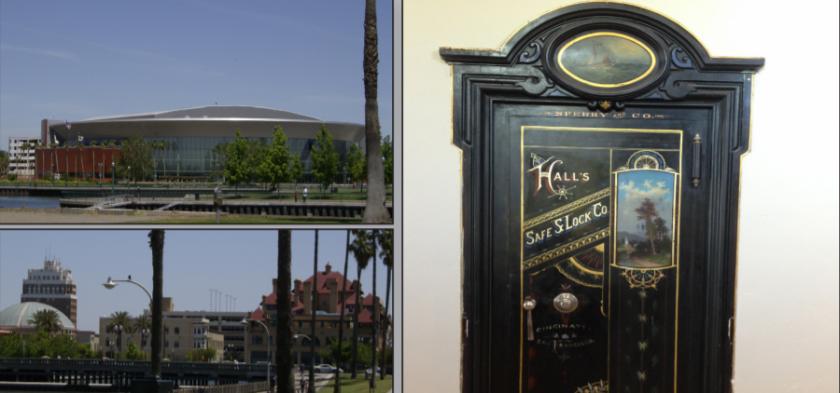
Lovely fenced outdoor garden area. In the heart of downtown Stockton’s waterfront
district. Built in the 1800’s as the corporate offices for Sperry Flour Mill, the building
faces Stockton’s downtown waterfront. It is beautifully constructed with extensive windows, tiled fireplaces, high coffered ceilings, exposed brick, and a gated outdoor courtyard.
This building was originally built in the 1888 as the offices for Sperry Flour Mill, and
expanded in 1915. The Sperry Flour Mill was an important part of Stockton’s earliest and
most significant industry. The company grew with seventeen mills across three states
and became one of the nation’s most famous companies.
No part of this information may be copied, reproduced, repurposed, or screen-captured for any commercial purpose without prior written authorization from MyEListing.
While we strive to provide the most accurate information, all listing information, and demographic data, is provided by third-parties. As such, MyEListing will not be responsible for the accuracy of the information. It is strongly recommended that you verify all information with the listing agent, and any relevant agencies, prior to making any decisions.
What is the building size of this commercial Office property?
The size of this multi-unit property varies between 2310 - 5000 square feet
What kind of Office is the propery at 146 West Weber Avenue?
The property at 146 West Weber Avenue Stockton, CA 95202 is listed as a Professional Office property
What is the population within 1 mile of 146 West Weber Avenue in Stockton?
The population within 1 mile of 146 West Weber Avenue Stockton, CA 95202 is 16,564 people.
Who do I contact for questions about 146 West Weber Avenue?
You should contact the listing agent,
Mahala Burns, for any details regarding this commercial listing.