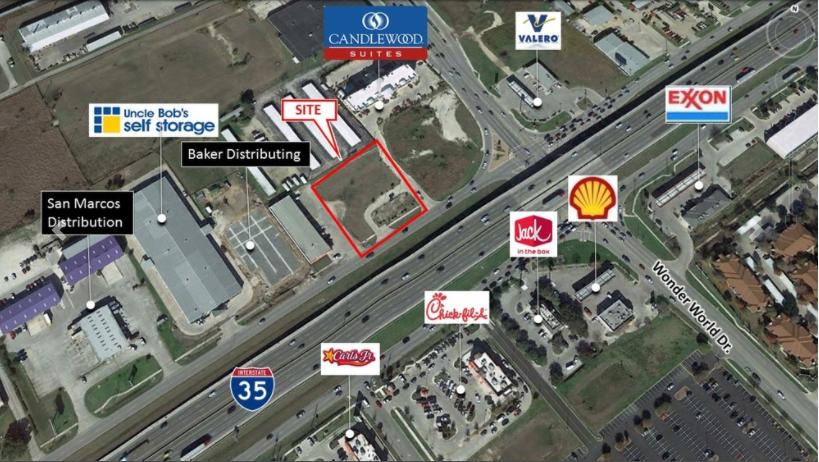
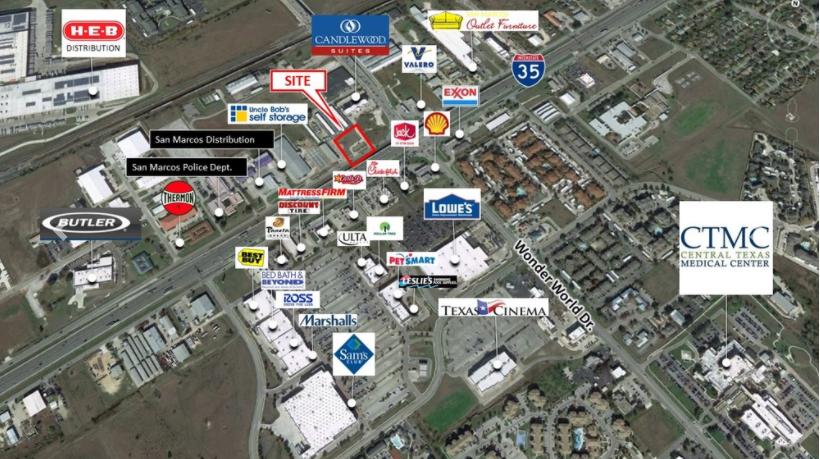
1-Mile | 3-Miles | 5-Miles | ||
---|---|---|---|---|
Total Population | 5,092 | 36,086 | 62,704 | |
Population Median Age | 40 | 33 | 32 | |
Population by Age | 0-9 Yrs | 338 (6%) | 2750 (7%) | 4858 (7%) |
10-19 Yrs | 397 (7%) | 6845 (18%) | 11088 (17%) | |
20-29 Yrs | 1715 (33%) | 11395 (31%) | 21985 (35%) | |
30-39 Yrs | 575 (11%) | 3861 (10%) | 6709 (10%) | |
40-49 Yrs | 418 (8%) | 3063 (8%) | 5276 (8%) | |
50-59 Yrs | 450 (8%) | 3120 (8%) | 5138 (8%) | |
60-69 Yrs | 364 (7%) | 2501 (6%) | 3759 (5%) | |
70+ Yrs | 834 (16%) | 2551 (7%) | 3892 (6%) | |
Median HH Income | $44,615 | $44,192 | $42,387 | |
Total Household Income | < 24K | 506 (24%) | 3482 (27%) | 6483 (28%) |
25-49K | 665 (31%) | 3420 (27%) | 6536 (29%) | |
50-74K | 417 (19%) | 2217 (17%) | 3864 (17%) | |
75-99K | 289 (13%) | 1304 (10%) | 2241 (10%) | |
100-199K | 190 (9%) | 1801 (14%) | 2730 (12%) | |
200K+ | 32 (1%) | 359 (2%) | 532 (2%) | |
Highest Education Level | No Diploma | 816 | 2746 | 4673 |
Diploma or GED | 796 | 4845 | 8761 | |
Some College | 772 | 4022 | 6844 | |
Assoc. Degree | 130 | 806 | 1603 | |
Bachelors Degree | 563 | 4179 | 6193 | |
Higher Degree | 310 | 2238 | 3438 | |
Total Housing Units | 2,319 | 13,597 | 24,325 | |
--Owner-Occupied | 572 | 4,647 | 7,634 | |
--Renter-Occupied | 1,527 | 7,936 | 14,752 | |
Owner-Occupied Values | < 100K | 177 | 1135 | 2070 |
100-199K | 329 | 1702 | 2766 | |
200-299K | 49 | 1077 | 1668 | |
300-399K | 10 | 455 | 679 | |
400-499K | 5 | 149 | 242 | |
500K+ | 3 | 129 | 211 | |
Total Working Age Population | 4,596 | 31,967 | 55,087 | |
In Work Force | 3,077 | 20,694 | 36,708 | |
Not In Work Force | 1,518 | 11,273 | 18,379 | |
Workforce Employed | 2,985 | 19,195 | 34,189 | |
Workforce Unemployed | 92 | 1,496 | 2,507 | |
Civlian Workforce | 3,077 | 20,691 | 36,696 | |
Military Workforce | 0 | 3 | 12 | |
Total Households | 2,099 | 12,583 | 22,386 | |
Family Households | 966 | 6,132 | 10,493 | |
Non-Family Households | 1,133 | 6,451 | 11,893 | |
Married Couple | 453 | 4,041 | 6,883 | |
Other Family | 513 | 2,091 | 3,610 | |
Married w/Child | 84 | 1,182 | 2,250 | |
Single Male w/Child | 29 | 192 | 329 | |
Single Female w/Child | 131 | 703 | 1,208 |
Population Change Last Two Decades - Plus Projection
2000 | % | 2010 | % | 2020 | % | 2030 | |
---|---|---|---|---|---|---|---|
Texas | 20,851,820 | +21 | 25,145,561 | +18 | 29,677,668 | +18 | 34,894,452 |
Caldwell County | 32,194 | +18 | 38,066 | +16 | 44,284 | +15 | 50,777 |
Comal County | 78,021 | +39 | 108,472 | +36 | 147,330 | +39 | 204,873 |
Guadalupe County | 89,023 | +48 | 131,533 | +29 | 170,266 | +30 | 221,353 |
Hays County | 97,589 | +61 | 157,107 | +50 | 234,896 | +48 | 347,120 |
Total Working Age Population:
Total Households:
Total Working Age Population:
Total Households:
Total Working Age Population:
Total Households: