The Best and Worst Cities for Women in Real Estate

Specializes in providing actionable insights into the commercial real estate space for investors, brokers, lessors, and lessees. He covers quarterly market data reports, investment strategies, how-to guides, and top-down perspectives on market movements.

Although the Bureau of Labor Statistics (BLS) predicts employment growth to be 4.1% for real estate agents from 2020 to 2030, the real estate industry has been shrinking considerably since 2017. The recession-style stop the economy suffered during the pandemic caused employment across all industries to drop by 13% in 2020, and the real estate industry was no exception.
An analysis of Census Bureau data by MyEListing analysts shows that, from 2017 to 2021, there was a 5% decrease in total employment in the real estate industry for both residential and commercial real estate professionals, as well as women in renting and leasing.
While women lost fewer jobs than men over that time period (a 2% drop in employment for women compared to an 8% drop in employment for men in the industry), data shows women still make up a slightly smaller percentage of the real estate workforce than men.
Our analysis shows that, of the nearly 3 million working in the real estate sector, 48% are women. However, despite this near-parity of gender employment percentages, a gender pay gap still exists. Women in real estate only earn 89.2% of mens’ salaries in the industry on average, only a 0.1% increase over the past 5 years.
Furthermore, while median salaries have increased by an average of 20% for both genders since 2017, women in real estate still make $6,662 less per year compared to men.
While that number may seem small, it adds up over time: , Over the course of a career (assuming work from 18 to 65 years old), that $6,662 annual loss equates to $313,114 less earned for women.
Key National Findings:
- Women in real estate make 89.2% of men’s earnings.
- The gender pay gap (women’s earnings as a percent of mens’) has only increased by 0.1% over the past 5 years.
- The national gender pay gap is $6,662 per year, which equates to about $313,114 over the course of a career (from 18 to 65 years old).
- Of the nearly 3 million working in the real estate sector, 48% are women.
- Wages increased by an average of 20% for both genders since 2017.
- Female employment has decreased by 1.9% since 2017 while male employment decreased by 7.7%. Overall, the real estate industry lost 5.0% employment since 2017.
National Median Real Estate Earnings
Here is a national outlook of real estate earnings:
| 2021 All Genders Median Earnings | % Change Since 2017 | 2021 Female Earnings | Female % Change Since 2017 | 2021 Male Earnings | Male % Change Since 2017 |
|---|---|---|---|---|---|
| $58,538 | 20% | $54,880 | 20% | $61,542 | 20% |
National Real Estate Employment
Here is a national outlook of real estate employment:
| All Genders % Employment Change Since 2017 | Female % Change Since 2017 | Male % Change Since 2017 | 2021 % Female in Real Estate | 2021 % Male in Real Estate |
|---|---|---|---|---|
| -5% | -2% | -8% | 48% | 52% |
Though there’s still room for growth as far as equity in the industry, women in real estate today have a unique opportunity to make strides in the sector. And, depending on where they’re based, some women will have a much better chance to succeed in the industry than others due to location-specific factors, such as local gender pay gaps and the percentages of women currently in the industry in different cities.
Keeping this top of mind, we dove into US Census data to find which cites and metro areas are the best for women in real estate. To do this, we compared each of the 100 biggest metro areas in the US across four different metrics:
- The gender pay gap between women and men;
- The percentage of women making up the real estate workforce;
- Five-year growth rate for women in real estate; and
- The median income of women in real estate.
For a more detailed breakdown of the final ranking and our data sources, you can see our methodology section at the end of the article.
The 10 Best Metros for Women in Real Estate:
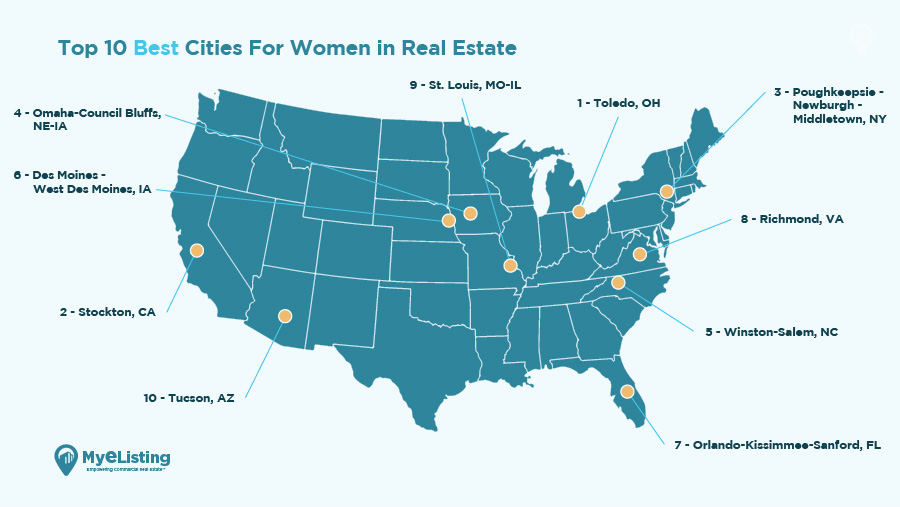
Based on our findings, these are the 10 best cities for women to work in real estate:
- Toledo, OH;
- Stockton, CA;
- Poughkeepsie-Newburgh-Middletown, NY;
- Omaha-Council Bluffs, NE-IA;
- Winston-Salem, NC;
- Des Moines-West Des Moines, IA;
- Orlando-Kissimmee-Sanford, FL;
- Richmond, VA;
- St. Louis, MO-IL; and
- Tucson, AZ.
Toledo, Ohio; Stockton, California; and Poughkeepsie-Newburgh-Middletown, New York are the top three best cities for women in real estate.
Toledo, Ohio was the best city for women in real estate. Women employed in real estate make 136% earnings compared to men in Toledo, the 4th-highest in the nation. Women also occupy 59% of all real estate jobs in the city, the 6th-highest ratio in the country. Toledo saw a 98% increase in real estate job employment, the 2nd-biggest increase in the country. It also has the 5th-highest average salary at $78,782.
Stockton, California was second best metro for women in real estate. Women make 155% the wages of men, the 2nd-highest ratio in the country. The average salary for women in Stockton is $86,818, the most in the country. Additionally, 58% of people employed in real estate in Stockton are women, the 7th-highest rate.
Coming in third place was Poughkeepsie-Newburgh-Middletown, New York. It saw a 368% increase in females employed in real estate, the biggest increase in the country. Women make 103% earnings as a percentage of mens.
The 10 Worst Metros for Women in Real Estate
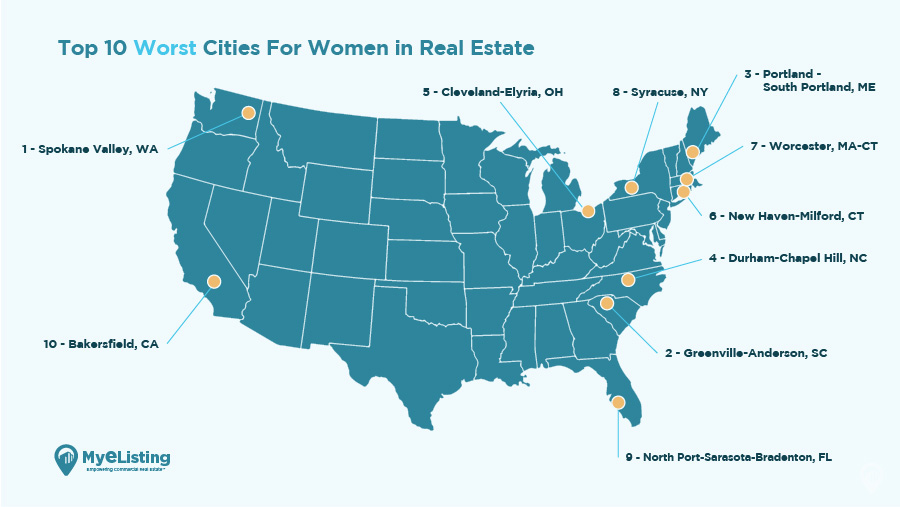
These are the 10 worst cities for women to work in real estate:
- Spokane-Spokane Valley, WA;
- Greenville-Anderson, SC;
- Portland-South Portland, ME;
- Durham-Chapel Hill, NC;
- Cleveland-Elyria, OH;
- New Haven-Milford, CT;
- Worcester, MA-CT;
- Syracuse, NY;
- North Port-Sarasota-Bradenton, FL; and
- Bakersfield, CA.
The top three worst cities for women in real estate are Spokane-Spokan Valley, Washington; Greenville-Anderson, South Carolina; and Portland-South Portland, Maine.
The worst city for women in real estate is Spokane-Spokane Valley, Washington. Women only make 55% the wages that men do, the 3rd-lowest ratio in the country. Additionally, the average salary for women in real estate in Spokane is $41,426, the 6th-lowest salary in the country. Women employed in real estate decreased by 33.9% in Spokane, the 4th-biggest drop nationally. Only 37% of people employed in real estate in this area are women, the 7th-lowest ratio.
The second-worst is Greenville-Anderson, South Carolina. Only 31% of people employed in real estate are women, the lowest ratio in the country. The city lost 33.1% women employed in real estate since 2017, the 6th-biggest decrease. Women make $45,854 per year, the 19th-lowest wage and 76% of the earnings that men make.
The third-worst is Portland-South Portland, Maine, which saw a 47% decrease in women employed in real estate since 2017, the biggest drop in the country. Only 36% of those employed in real estate are women with an average salary of $53,533, about 61% of what men make, the 5th-largest wage gap in the country.
Key findings for Cities:
- Ohio has the spot for the best city (#1, Toledo), but also some of the worst cities for women in real estate (#90, Akron and #96 Cleveland-Elyria).
- Iowa has two of the top cities for women in real estate.
- Connecticut has 2 of the worst cities for women in real estate.
Full Rank of the Best and Worst Cities for Women in Real Estate
Here is the full data table of the top 100 most populated cities in the country:
| Rank Best to Worst | Metro | Female % Employment Change in Real Estate | 2021 Female % of All Workers in Real Estate | 2021 Female Median Earnings in Real Estate | 2021 Women’s Earnings As a % of Mens in Real Estate |
|---|---|---|---|---|---|
| 1 | Toledo, OH | 98% | 59% | $78,782 | 136% |
| 2 | Stockton, CA | -14% | 58% | $86,818 | 155% |
| 3 | Poughkeepsie-Newburgh-Middletown, NY | 368% | 51% | $63,947 | 103% |
| 4 | Omaha-Council Bluffs, NE-IA | 40% | 57% | $54,217 | 125% |
| 5 | Winston-Salem, NC | 13% | 58% | $57,034 | 120% |
| 6 | Des Moines-West Des Moines, IA | 27% | 48% | $66,905 | 130% |
| 7 | Orlando-Kissimmee-Sanford, FL | 35% | 55% | $52,003 | 124% |
| 8 | Richmond, VA | -2% | 56% | $65,531 | 109% |
| 9 | St. Louis, MO-IL | 23% | 54% | $58,424 | 99% |
| 10 | Tucson, AZ | 48% | 55% | $58,247 | 91% |
| 11 | Indianapolis-Carmel-Anderson, IN | 25% | 51% | $62,518 | 95% |
| 12 | Albuquerque, NM | 74% | 48% | $53,092 | 115% |
| 13 | San Francisco-Oakland-Berkeley, CA | 0% | 48% | $85,284 | 108% |
| 14 | Baton Rouge, LA | -7% | 47% | $82,730 | 146% |
| 15 | Grand Rapids-Kentwood, MI | -1% | 47% | $74,167 | 113% |
| 16 | Charlotte-Concord-Gastonia, NC-SC | 6% | 46% | $72,007 | 108% |
| 17 | Minneapolis-St. Paul-Bloomington, MN-WI | 12% | 50% | $62,162 | 95% |
| 18 | Dayton-Kettering, OH | -11% | 50% | $65,398 | 108% |
| 19 | Memphis, TN-MS-AR | 23% | 64% | $48,066 | 93% |
| 20 | Las Vegas-Henderson-Paradise, NV | 9% | 53% | $51,141 | 102% |
| 21 | Deltona-Daytona Beach-Ormond Beach, FL | 1% | 64% | $51,970 | 94% |
| 22 | Sacramento-Roseville-Folsom, CA | -25% | 49% | $71,730 | 126% |
| 23 | Oklahoma City, OK | 25% | 58% | $50,387 | 91% |
| 24 | Salt Lake City, UT | 50% | 53% | $59,196 | 75% |
| 25 | Phoenix-Mesa-Chandler, AZ | 0% | 47% | $67,345 | 101% |
| 26 | Fayetteville-Springdale-Rogers, AR | 78% | 58% | $49,383 | 79% |
| 27 | Dallas-Fort Worth-Arlington, TX | 0% | 49% | $62,300 | 99% |
| 28 | Bridgeport-Stamford-Norwalk, CT | 26% | 46% | $72,202 | 90% |
| 29 | Providence-Warwick, RI-MA | 35% | 47% | $64,498 | 86% |
| 30 | Allentown-Bethlehem-Easton, PA-NJ | 12% | 38% | $62,345 | 113% |
| 31 | Greensboro-High Point, NC | 43% | 53% | $50,823 | 83% |
| 32 | Virginia Beach-Norfolk-Newport News, VA-NC | -12% | 57% | $53,639 | 96% |
| 33 | Colorado Springs, CO | 13% | 44% | $57,841 | 106% |
| 34 | Palm Bay-Melbourne-Titusville, FL | -37% | 48% | $66,006 | 181% |
| 35 | Atlanta-Sandy Springs-Alpharetta, GA | -9% | 50% | $61,027 | 97% |
| 36 | Madison, WI | -13% | 40% | $67,457 | 131% |
| 37 | Portland-Vancouver-Hillsboro, OR-WA | -14% | 53% | $73,363 | 85% |
| 38 | Knoxville, TN | 26% | 52% | $54,339 | 78% |
| 39 | Philadelphia-Camden-Wilmington, PA-NJ-DE-MD | 6% | 46% | $63,324 | 94% |
| 40 | Houston-The Woodlands-Sugar Land, TX | -6% | 51% | $52,474 | 100% |
| 41 | Charleston-North Charleston, SC | 31% | 46% | $54,659 | 94% |
| 42 | Lakeland-Winter Haven, FL | 7% | 57% | $48,206 | 86% |
| 43 | Seattle-Tacoma-Bellevue, WA | 2% | 49% | $69,899 | 76% |
| 44 | Rochester, NY | -14% | 51% | $50,710 | 120% |
| 45 | Louisville/Jefferson County, KY-IN | 22% | 53% | $45,516 | 87% |
| 46 | Wichita, KS | 63% | 56% | $37,326 | 82% |
| 47 | Tulsa, OK | -1% | 55% | $48,183 | 92% |
| 48 | Milwaukee-Waukesha, WI | 20% | 50% | $51,652 | 86% |
| 49 | Harrisburg-Carlisle, PA | -3% | 39% | $60,266 | 115% |
| 50 | Jacksonville, FL | 31% | 54% | $43,126 | 84% |
| 51 | Tampa-St. Petersburg-Clearwater, FL | 6% | 50% | $47,349 | 95% |
| 52 | Columbus, OH | -6% | 46% | $57,348 | 106% |
| 53 | Boston-Cambridge-Newton, MA-NH | -17% | 46% | $75,144 | 94% |
| 54 | Washington-Arlington-Alexandria, DC-VA-MD-WV | -7% | 46% | $81,774 | 86% |
| 55 | Los Angeles-Long Beach-Anaheim, CA | -11% | 47% | $61,029 | 95% |
| 56 | Raleigh-Cary, NC | -26% | 53% | $68,670 | 84% |
| 57 | McAllen-Edinburg-Mission, TX | 35% | 57% | $36,999 | 79% |
| 58 | Austin-Round Rock-Georgetown, TX | -6% | 50% | $57,762 | 87% |
| 59 | Detroit-Warren-Dearborn, MI | -4% | 49% | $54,212 | 91% |
| 60 | Buffalo-Cheektowaga, NY | -27% | 46% | $63,720 | 108% |
| 61 | New Orleans-Metairie, LA | -6% | 62% | $43,927 | 87% |
| 62 | El Paso, TX | 59% | 61% | $27,682 | 44% |
| 63 | Nashville-Davidson-Murfreesboro-Franklin, TN | 21% | 52% | $51,365 | 71% |
| 64 | Denver-Aurora-Lakewood, CO | -1% | 48% | $63,559 | 76% |
| 65 | Little Rock-North Little Rock-Conway, AR | 8% | 53% | $45,738 | 82% |
| 66 | Cincinnati, OH-KY-IN | -15% | 43% | $55,968 | 116% |
| 67 | San Jose-Sunnyvale-Santa Clara, CA | -7% | 48% | $73,347 | 72% |
| 68 | Chicago-Naperville-Elgin, IL-IN-WI | 7% | 47% | $57,509 | 80% |
| 69 | Miami-Fort Lauderdale-Pompano Beach, FL | 5% | 48% | $46,647 | 92% |
| 70 | San Diego-Chula Vista-Carlsbad, CA | -23% | 45% | $61,158 | 103% |
| 71 | Riverside-San Bernardino-Ontario, CA | -24% | 50% | $50,967 | 97% |
| 72 | Urban Honolulu, HI | -26% | 48% | $52,082 | 100% |
| 73 | Columbia, SC | 39% | 50% | $39,258 | 67% |
| 74 | Birmingham-Hoover, AL | 37% | 49% | $44,511 | 66% |
| 75 | Boise City, ID | 1% | 40% | $44,481 | 106% |
| 76 | Kansas City, MO-KS | -6% | 44% | $55,120 | 87% |
| 77 | Pittsburgh, PA | -12% | 39% | $55,743 | 96% |
| 78 | Springfield, MA | 2% | 47% | $50,793 | 83% |
| 79 | Fresno, CA | -29% | 62% | $47,245 | 80% |
| 80 | Baltimore-Columbia-Towson, MD | -26% | 41% | $62,833 | 92% |
| 81 | Ogden-Clearfield, UT | -11% | 40% | $61,696 | 85% |
| 82 | Cape Coral-Fort Myers, FL | -2% | 56% | $42,838 | 67% |
| 83 | New York-Newark-Jersey City, NY-NJ-PA | -15% | 36% | $62,063 | 90% |
| 84 | San Antonio-New Braunfels, TX | -14% | 51% | $47,391 | 78% |
| 85 | Provo-Orem, UT | 34% | 36% | $47,128 | 75% |
| 86 | Chattanooga, TN-GA | -19% | 41% | $61,453 | 79% |
| 87 | Hartford-East Hartford-Middletown, CT | -20% | 34% | $49,066 | 97% |
| 88 | Lancaster, PA | -15% | 48% | $51,004 | 63% |
| 89 | Oxnard-Thousand Oaks-Ventura, CA | -33% | 53% | $46,699 | 56% |
| 90 | Akron, OH | -21% | 46% | $42,199 | 90% |
| 91 | Bakersfield, CA | -43% | 35% | $45,314 | 106% |
| 92 | North Port-Sarasota-Bradenton, FL | -16% | 48% | $46,412 | 51% |
| 93 | Syracuse, NY | 7% | 40% | $37,530 | 66% |
| 94 | Worcester, MA-CT | -18% | 32% | $55,716 | 75% |
| 95 | New Haven-Milford, CT | -26% | 41% | $44,369 | 88% |
| 96 | Cleveland-Elyria, OH | -14% | 42% | $41,786 | 73% |
| 97 | Durham-Chapel Hill, NC | -29% | 47% | $44,671 | 73% |
| 98 | Portland-South Portland, ME | -47% | 37% | $53,533 | 61% |
| 99 | Greenville-Anderson, SC | -33% | 31% | $45,854 | 76% |
| 100 | Spokane-Spokane Valley, WA | -34% | 37% | $41,426 | 55% |
Our findings discovered that, while some cities are current hot spots for real estate, they may not be as friendly to women working in the market.
For example, the real estate market in Boise, Idaho has been booming since the pandemic but ranks number 75 on our list for women in working in the industry, mainly due to its lower median salary for women and female empolyent growth. Similarly, although the Spokane real estate market has been on an uptick lately, the city ranks as dead last: #100 in our rankings.
Despite this obvious inequality, the data shows that women today have an especially unique opportunity to make progress in the field. With this report, we hope to provide a comprehensive analysis to help those who are aspiring to work in the field succeed.
Methodology:
To find the best cities for women working in the real estate, rental, and leasing sector, MyEListing.com analysts collected and compared data for each of the 100 largest metropolitan areas in the U.S., based on four different metrics:
- Employment growth rate for women in real estate. This is the percent change in women employed in the real estate (RE) industry over the past 5 years (2021 compared to 2017).
- Women as a percentage of the real estate workforce. The percentage of female workers currently employed in the RE industry in 2021.
- Total earnings for women in real estate. These are the 2021 median earnings for full-time, year-round women employed in the RE industry.
- Gender pay gap in the real estate industry. These are the 2021 women’s earnings as a percentage of men’s earnings in the RE industry.
We ranked each metro area in each of these four metrics. Then, we found each metro area’s average ranking across all four metrics and used this to determine a final ranking. The metro with the highest average ranking received a rank of 1, while the city with the lowest average ranking received a score of 100.
We pulled all data from the US Census Bureau’s 2021 and 2017 one-year estimates of the American Community Survey.


Other recent articles


Article Search
Share
All Article Categories
