Office Space
3724 Executive Center Drive Austin, TX 78731
3724 Executive Center Drive Austin, TX 78731

Details & Description
Property Highlights
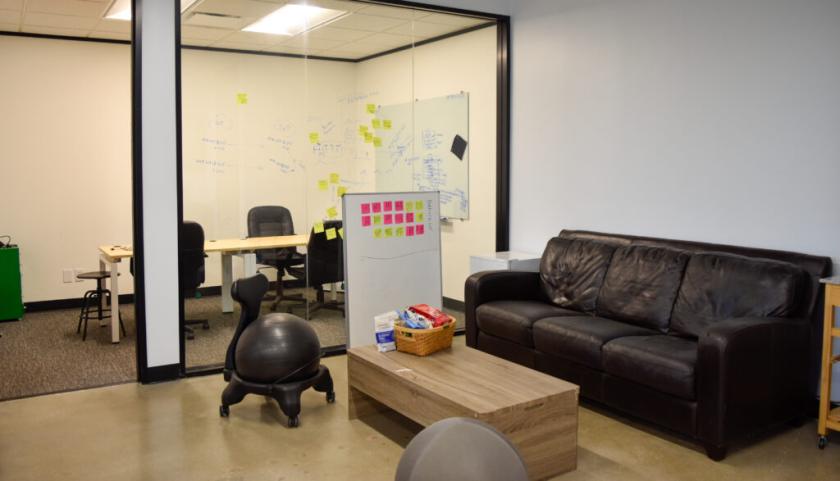
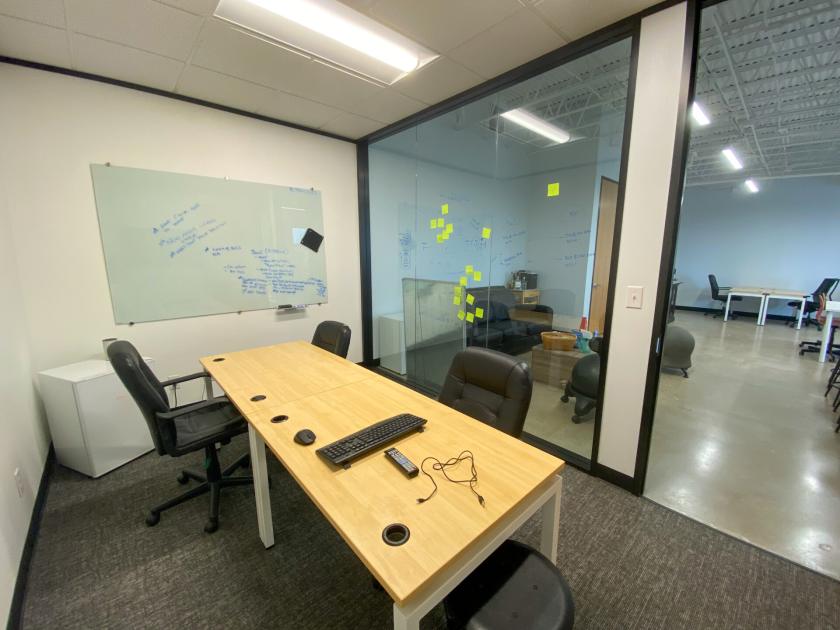
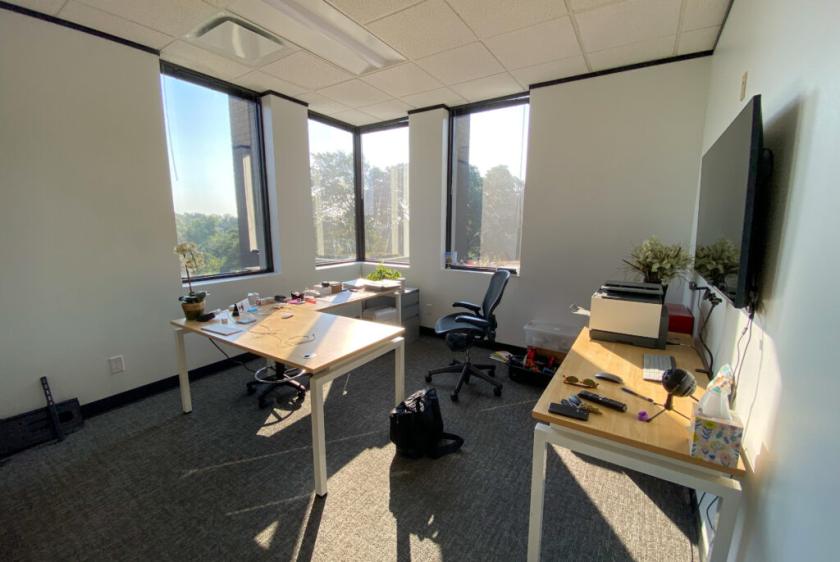
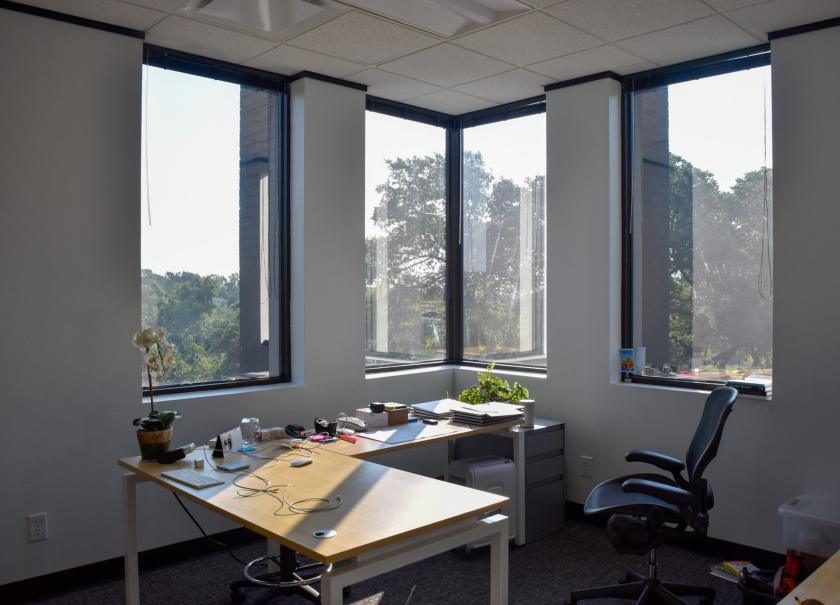
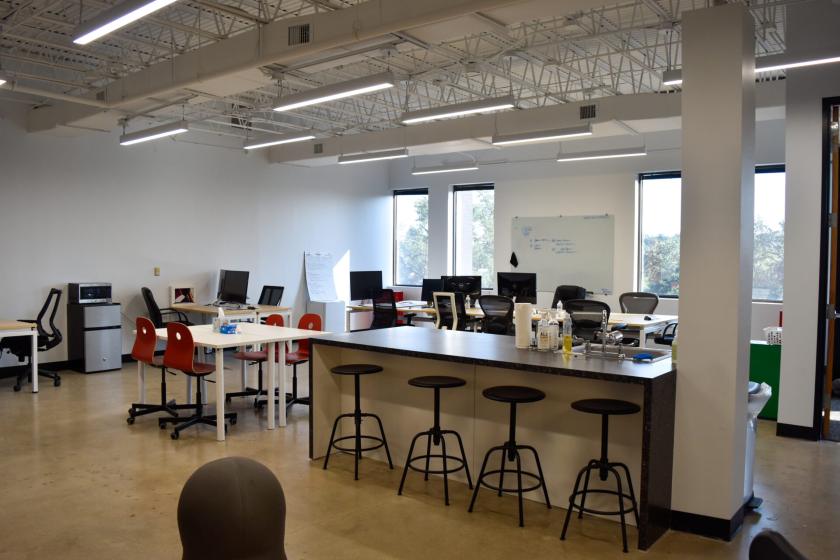
• Primarily open layout with two private offices, a conference room, and a break area
• Recently re-done space with class A office finishes
Additional Photos


Listing Agents

Rick Lange
M: 512-538-2092
rlange@hpitx.com
M: 512-538-2092
rlange@hpitx.com
While we strive to provide the most accurate information, all listing information, and demographic data, is provided by third-parties. As such, MyEListing will not be responsible for the accuracy of the information. It is strongly recommended that you verify all information with the listing agent, and any relevant agencies, prior to making any decisions.