Office Space
915 West Exchange Parkway Allen, TX 75013
915 West Exchange Parkway Allen, TX 75013

Details & Description
Property Highlights
• Direct Access to Central Expressway & SH 121 via Exchange Parkway
• Located Just West of Presbyterian Hospital Allen
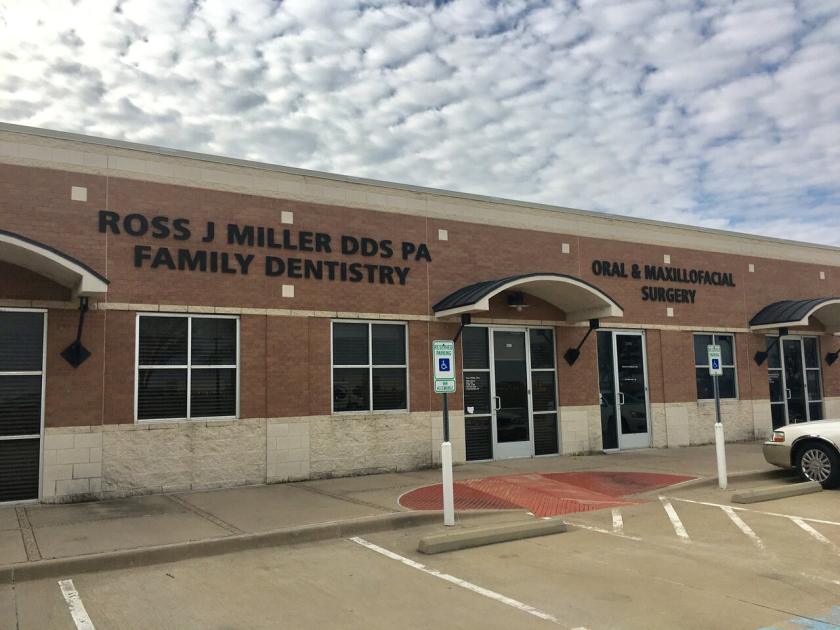
Additional Photos


Listing Agents

Debi Carter
O: 214-673-9387
M: 214-673-9387
dcarter@capstonecommercial.com
O: 214-673-9387
M: 214-673-9387
dcarter@capstonecommercial.com
While we strive to provide the most accurate information, all listing information, and demographic data, is provided by third-parties. As such, MyEListing will not be responsible for the accuracy of the information. It is strongly recommended that you verify all information with the listing agent, and any relevant agencies, prior to making any decisions.


