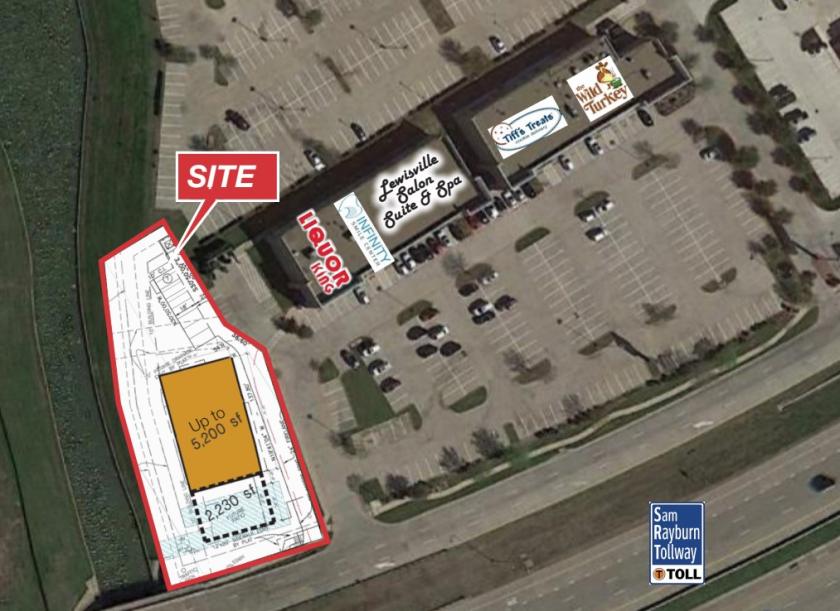
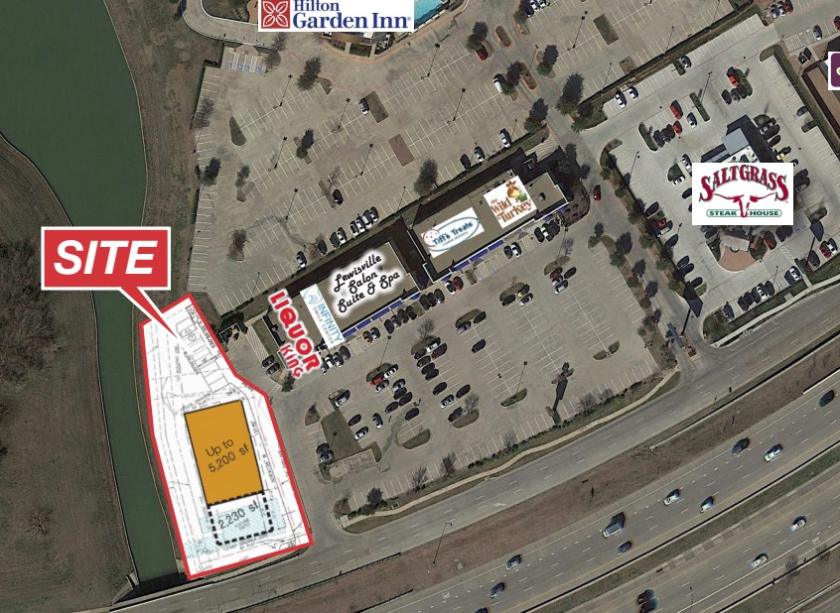
1-Mile | 3-Miles | 5-Miles | ||
---|---|---|---|---|
Total Population | 9,779 | 90,661 | 237,854 | |
Population Median Age | 36 | 36 | 36 | |
Population by Age | 0-9 Yrs | 1325 (13%) | 11694 (12%) | 30273 (12%) |
10-19 Yrs | 1052 (10%) | 11547 (12%) | 33396 (14%) | |
20-29 Yrs | 1661 (16%) | 14252 (15%) | 33118 (13%) | |
30-39 Yrs | 1646 (16%) | 14774 (16%) | 40302 (16%) | |
40-49 Yrs | 1482 (15%) | 13151 (14%) | 36071 (15%) | |
50-59 Yrs | 1340 (13%) | 13156 (14%) | 33061 (13%) | |
60-69 Yrs | 645 (6%) | 7337 (8%) | 18270 (7%) | |
70+ Yrs | 627 (6%) | 4750 (5%) | 13364 (5%) | |
Median HH Income | $87,473 | $81,839 | $85,522 | |
Total Household Income | < 24K | 329 (8%) | 2995 (8%) | 7702 (8%) |
25-49K | 694 (18%) | 6603 (18%) | 15304 (17%) | |
50-74K | 608 (15%) | 6665 (18%) | 15255 (17%) | |
75-99K | 555 (14%) | 5079 (14%) | 13362 (15%) | |
100-199K | 1201 (31%) | 9255 (26%) | 25662 (29%) | |
200K+ | 428 (11%) | 4707 (13%) | 10486 (11%) | |
Highest Education Level | No Diploma | 269 | 3672 | 14706 |
Diploma or GED | 1107 | 9945 | 28812 | |
Some College | 1488 | 13130 | 29508 | |
Assoc. Degree | 396 | 3973 | 10509 | |
Bachelors Degree | 2334 | 21007 | 50650 | |
Higher Degree | 1291 | 10961 | 27039 | |
Total Housing Units | 4,112 | 37,478 | 92,691 | |
--Owner-Occupied | 1,479 | 16,090 | 45,029 | |
--Renter-Occupied | 2,336 | 19,213 | 42,742 | |
Owner-Occupied Values | < 100K | 15 | 813 | 2234 |
100-199K | 31 | 1194 | 6744 | |
200-299K | 483 | 4169 | 13383 | |
300-399K | 494 | 4406 | 10658 | |
400-499K | 291 | 3094 | 6982 | |
500K+ | 165 | 2413 | 5028 | |
Total Working Age Population | 7,784 | 71,762 | 186,322 | |
In Work Force | 5,987 | 55,278 | 139,261 | |
Not In Work Force | 1,797 | 16,484 | 47,061 | |
Workforce Employed | 5,678 | 53,032 | 134,126 | |
Workforce Unemployed | 302 | 2,194 | 4,987 | |
Civlian Workforce | 5,980 | 55,226 | 139,113 | |
Military Workforce | 6 | 52 | 148 | |
Total Households | 3,815 | 35,303 | 87,771 | |
Family Households | 2,307 | 23,053 | 59,391 | |
Non-Family Households | 1,509 | 12,250 | 28,381 | |
Married Couple | 1,651 | 17,777 | 46,457 | |
Other Family | 656 | 5,276 | 12,934 | |
Married w/Child | 869 | 8,391 | 23,055 | |
Single Male w/Child | 181 | 684 | 1,403 | |
Single Female w/Child | 196 | 2,398 | 5,892 |
Population Change Last Two Decades - Plus Projection
2000 | % | 2010 | % | 2020 | % | 2030 | |
---|---|---|---|---|---|---|---|
Texas | 20,851,820 | +21 | 25,145,561 | +18 | 29,677,668 | +18 | 34,894,452 |
Tarrant County | 1,446,219 | +25 | 1,809,034 | +19 | 2,143,755 | +17 | 2,507,170 |
Denton County | 432,976 | +53 | 662,614 | +36 | 897,953 | +37 | 1,234,110 |
Dallas County | 2,218,899 | +7 | 2,368,139 | +15 | 2,734,111 | +14 | 3,106,298 |
Total Working Age Population:
Total Households:
Total Working Age Population:
Total Households:
Total Working Age Population:
Total Households: