Commercial Land
US Hwy 281 New Carmen Ave Brownsville, TX 78520
US Hwy 281 New Carmen Ave Brownsville, TX 78520
Details & Description
Property Highlights
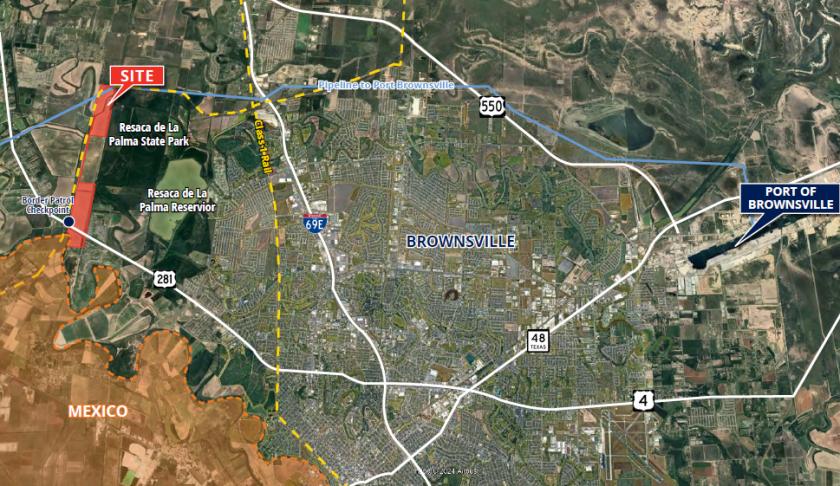
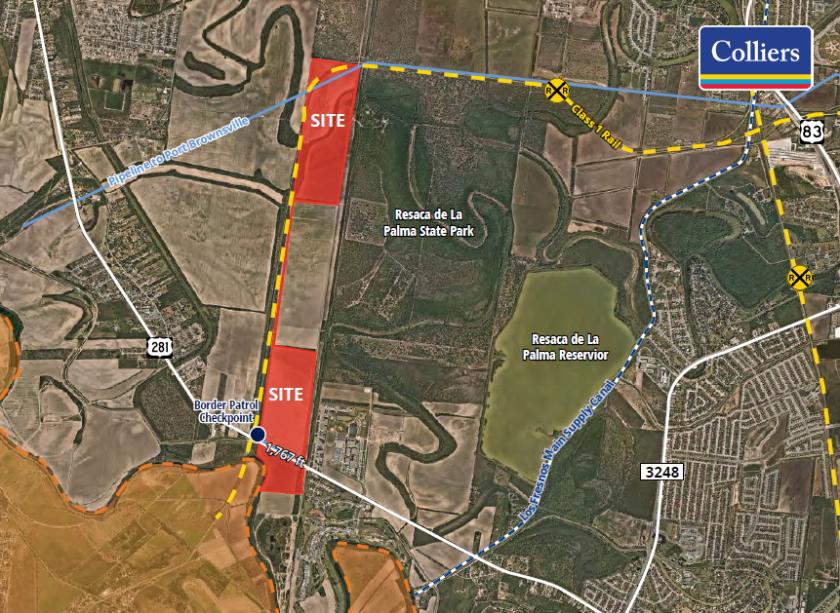
- • 338.13 AC
- • Ideal for Rail Site Yard
- • Pipeline to Port of Brownsville
- • Adjacent Border Patrol Checkpoint
- • Direct Access to Mexico
- • ±1,767 ft US Highway 281 frontage
Listing Agents

Jon Lindenberger
O: 713-830-2163
M: 713-252-4011
jon.lindenberger@colliers.com
O: 713-830-2163
M: 713-252-4011
jon.lindenberger@colliers.com

Chris Nash
O: 713-830-2153
M: 713-213-1306
chris.nash@colliers.com
O: 713-830-2153
M: 713-213-1306
chris.nash@colliers.com
While we strive to provide the most accurate information, all listing information, and demographic data, is provided by third-parties. As such, MyEListing will not be responsible for the accuracy of the information. It is strongly recommended that you verify all information with the listing agent, and any relevant agencies, prior to making any decisions.