Specialty Real Estate
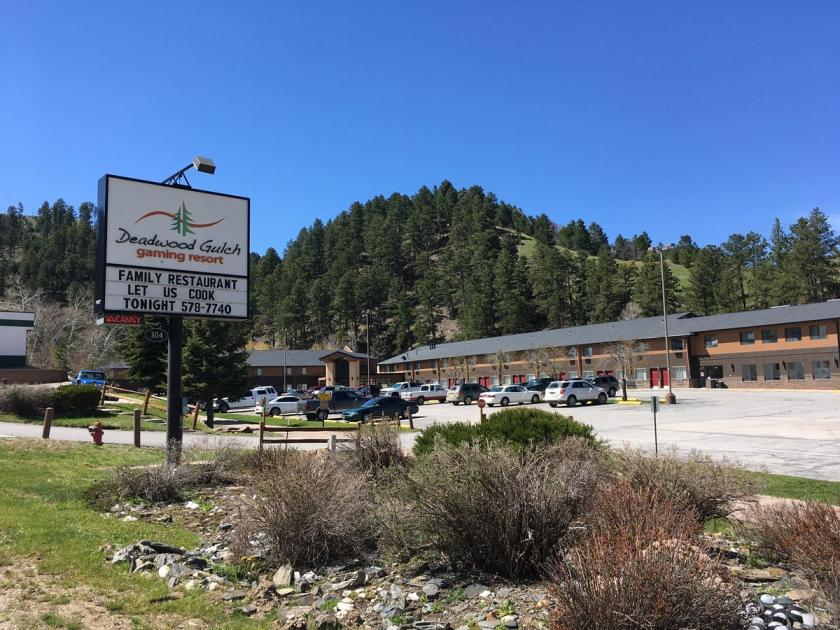
304 Cliff Street Deadwood, SD 57732
304 Cliff Street Deadwood, SD 57732
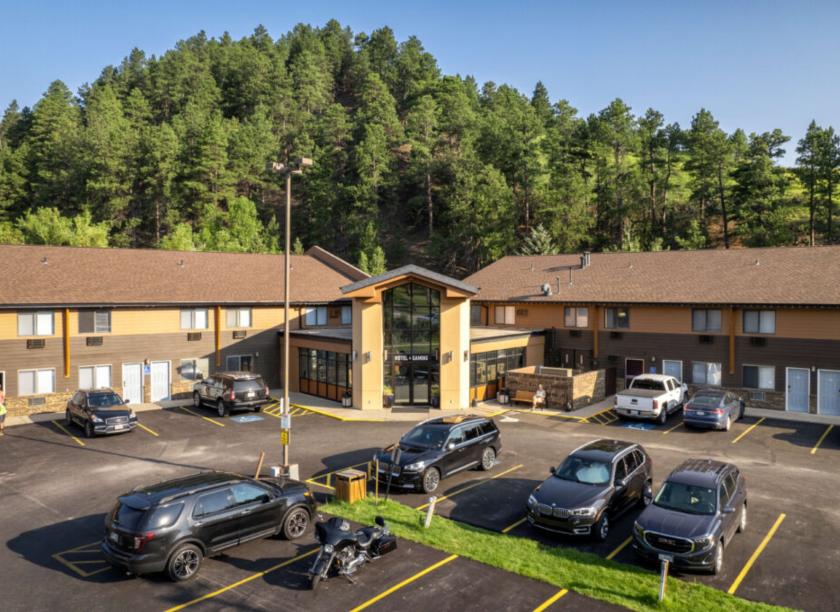
Details & Description
Property Highlights
- • Price per Room: $99,432
- • ADR: $26.58 - STR - From December 2023
- • GRM: 1.93X's 2023 figures
- • 2023 Revenue: $4.8 million after COGS
- • 2024 Projected Revenue: $5.3 million after COGS
- • 2023 Real Estate Taxes: $23,550
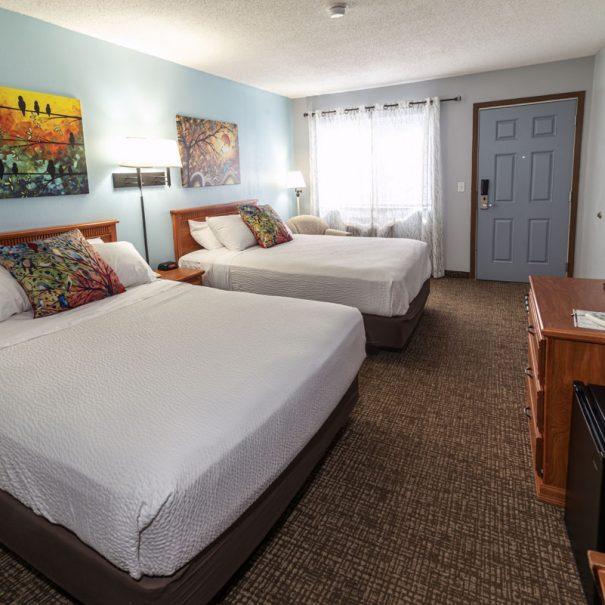
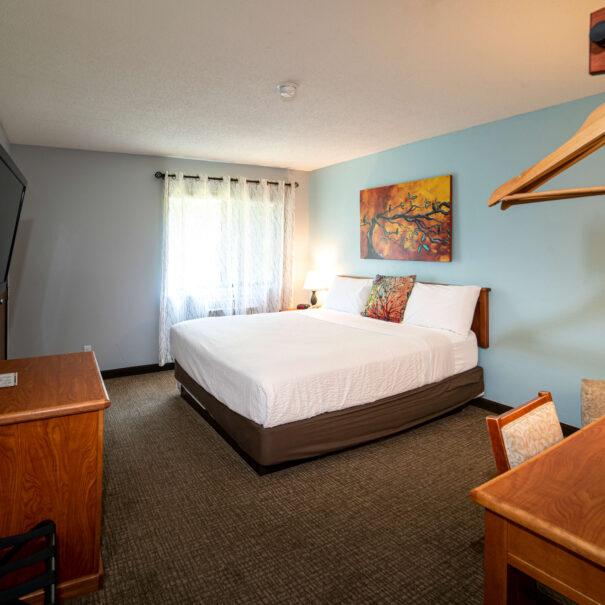
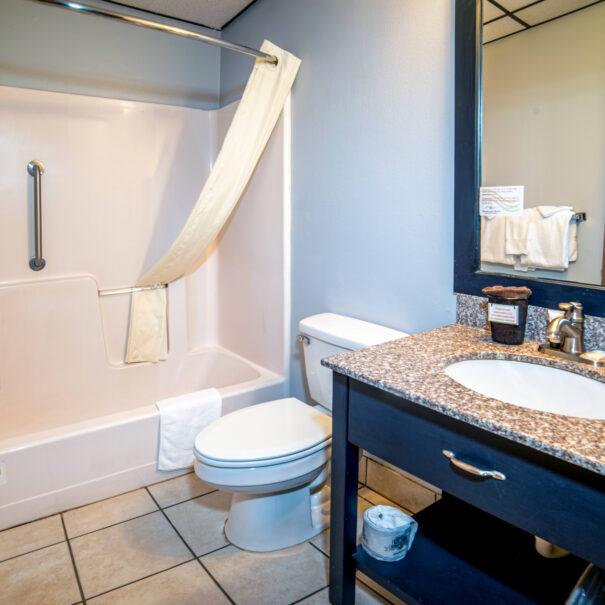
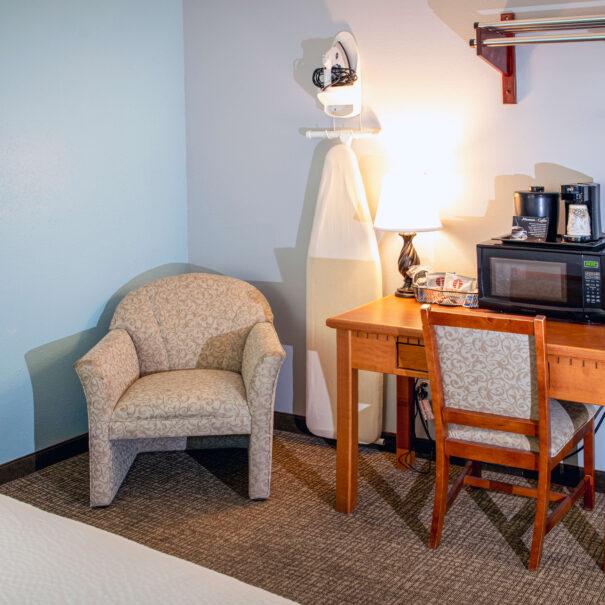
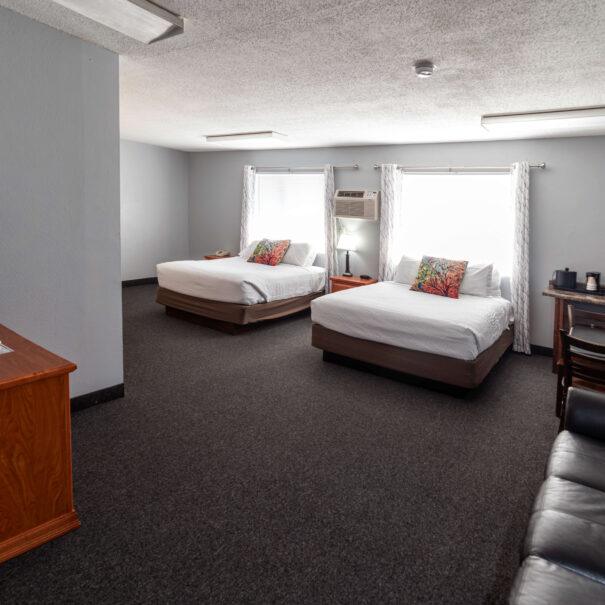
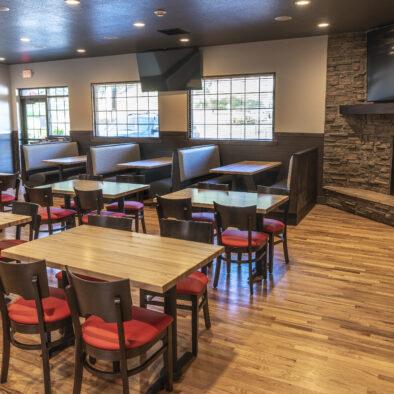
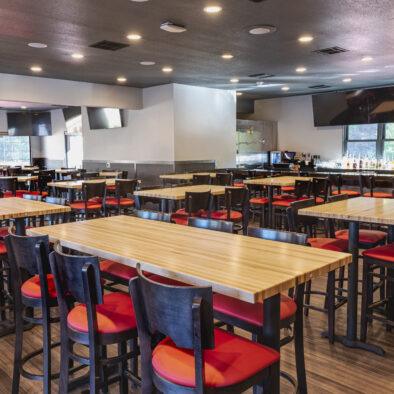
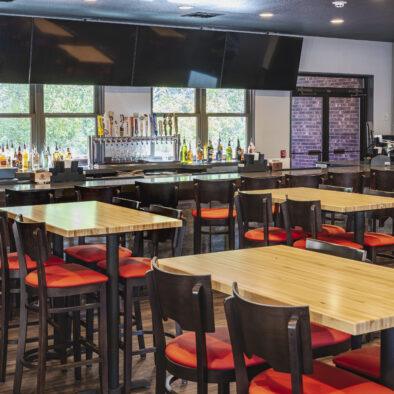
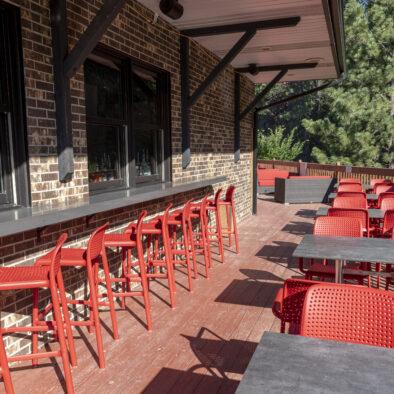
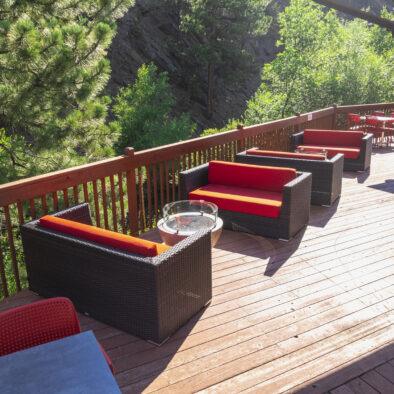
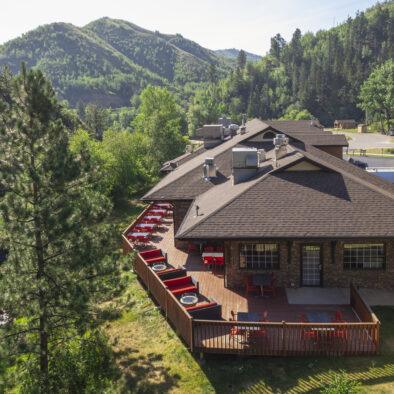
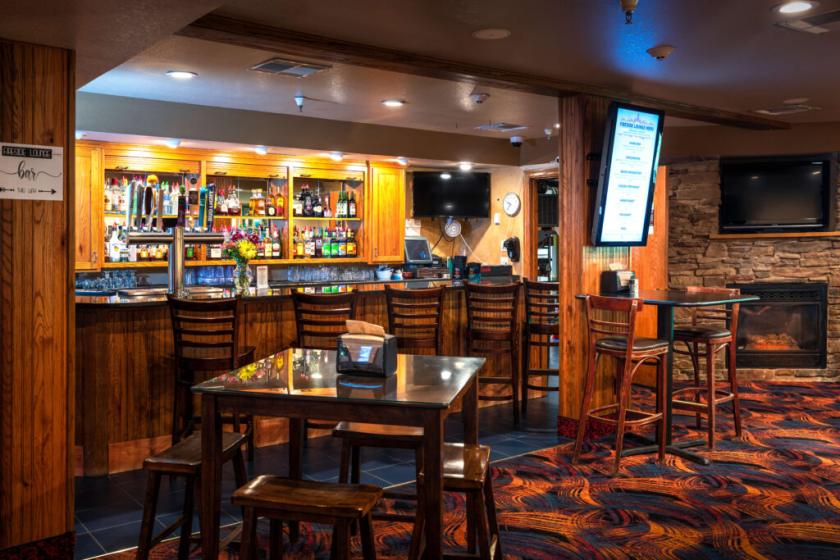
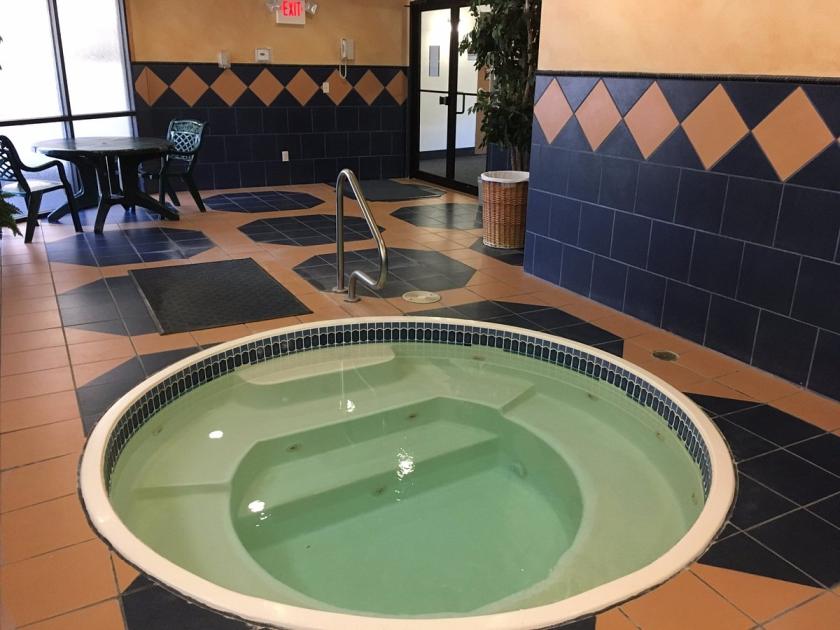
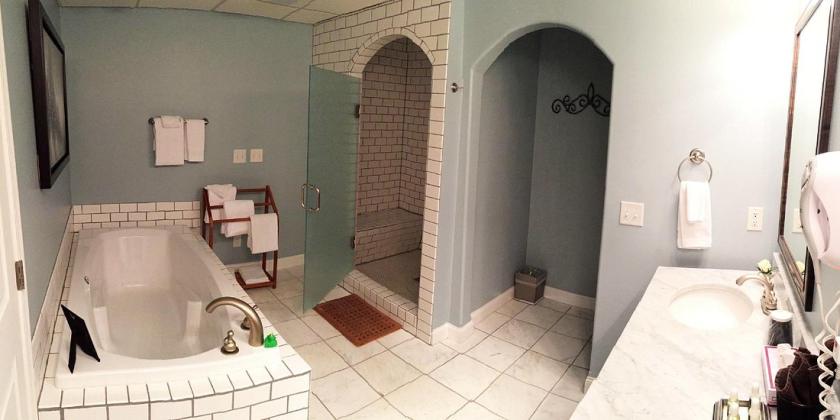
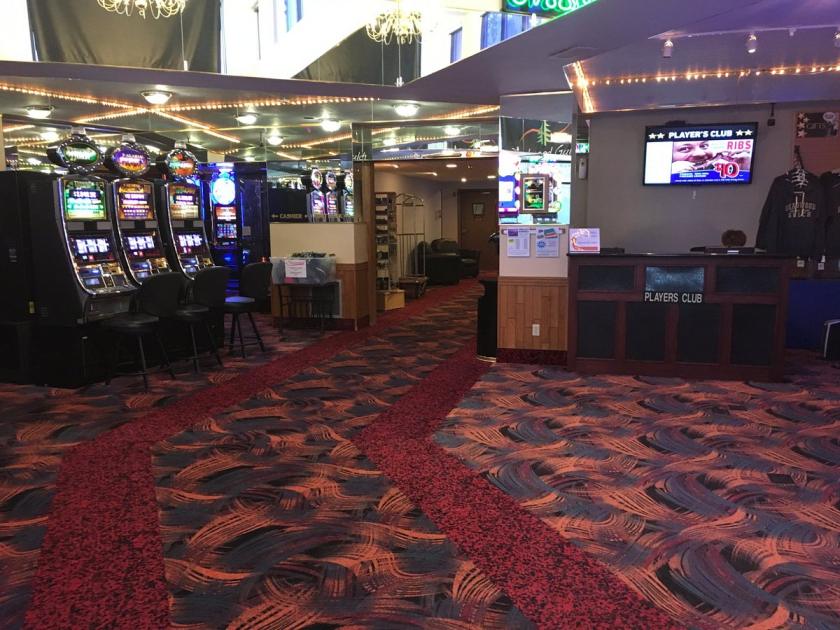
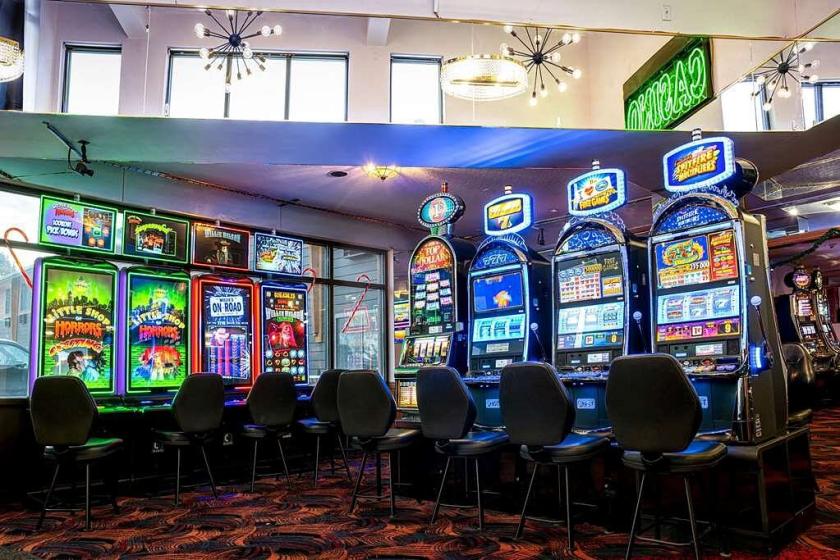
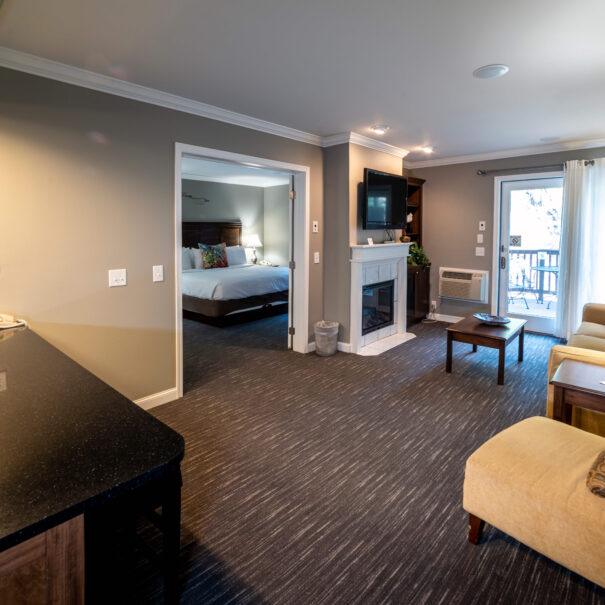
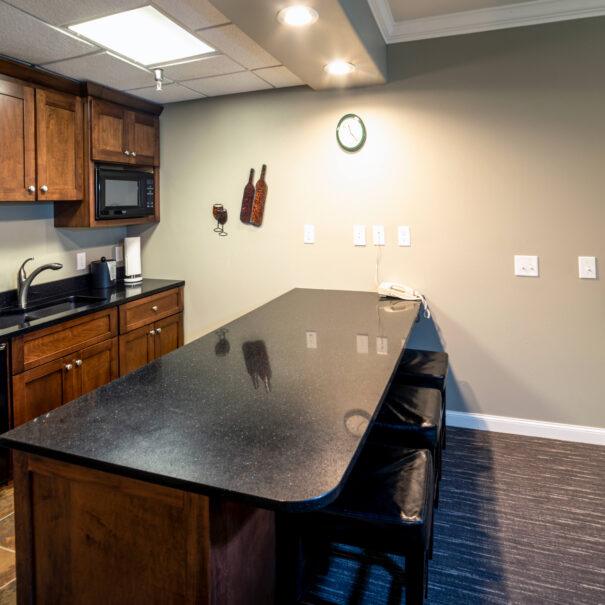
Additional Photos
Listing Agents

Dale Zomer
O: 605-444-7117
M: 605-351-1218
dzomer@naisiouxfalls.com
O: 605-444-7117
M: 605-351-1218
dzomer@naisiouxfalls.com
While we strive to provide the most accurate information, all listing information, and demographic data, is provided by third-parties. As such, MyEListing will not be responsible for the accuracy of the information. It is strongly recommended that you verify all information with the listing agent, and any relevant agencies, prior to making any decisions.