Commercial Land
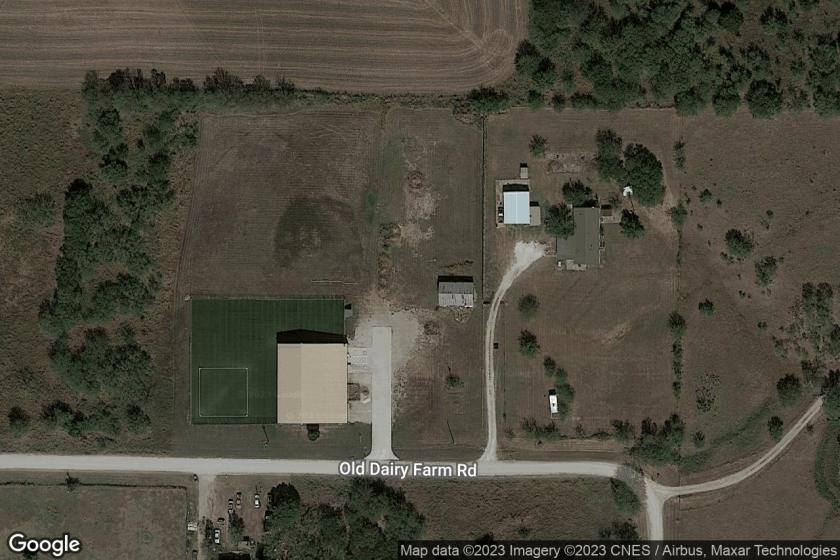
15823 Old Dairy Farm Road Prosper, TX 75078
15823 Old Dairy Farm Road Prosper, TX 75078
Details & Description
Property Highlights
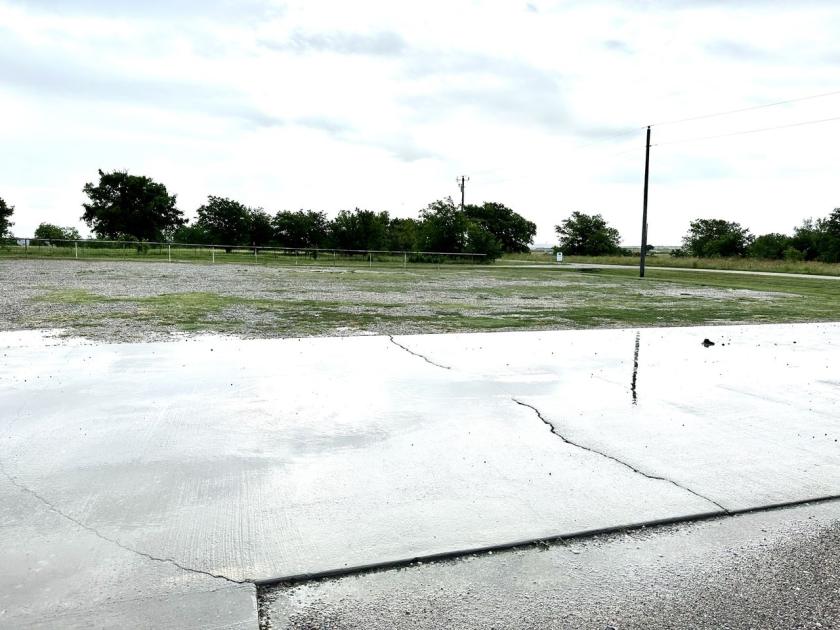
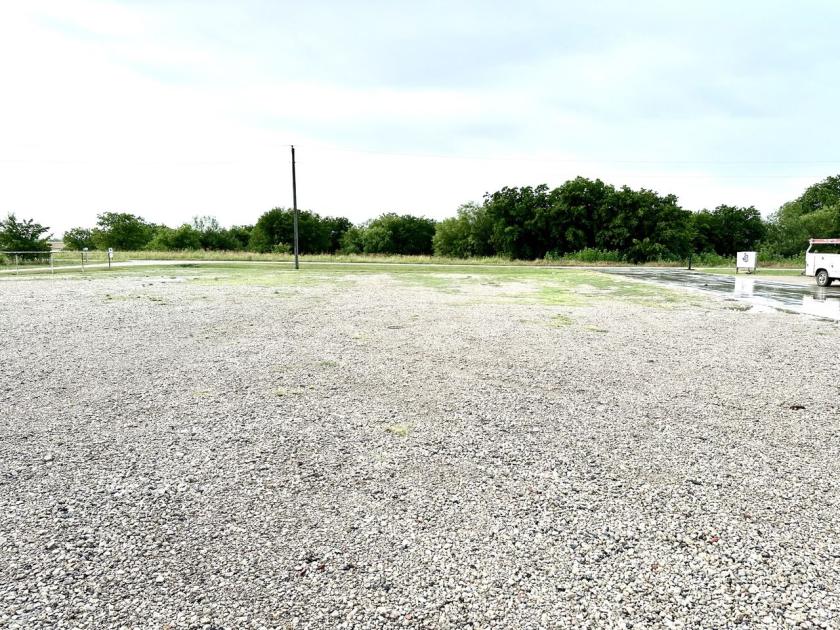
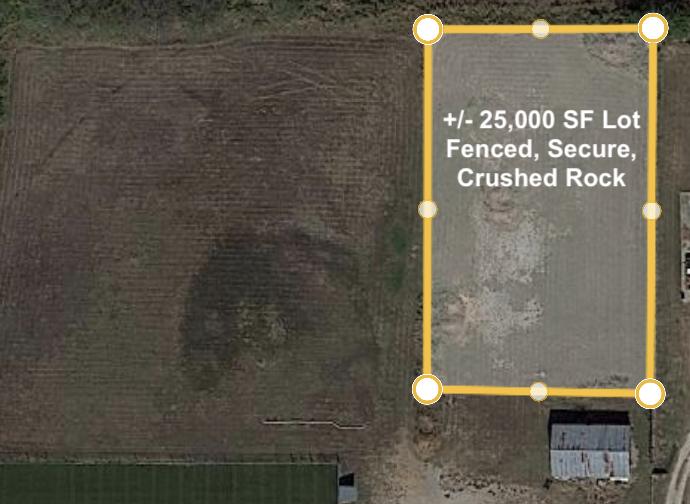
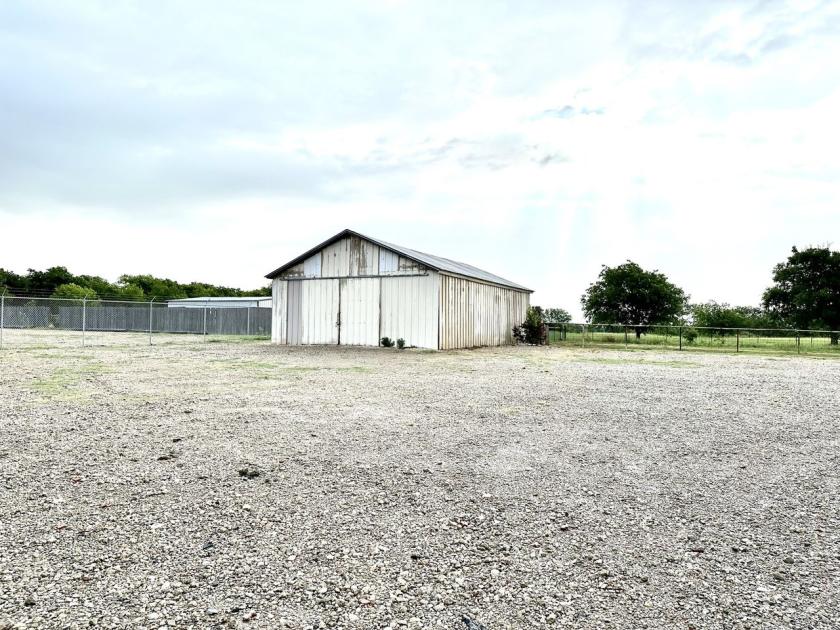
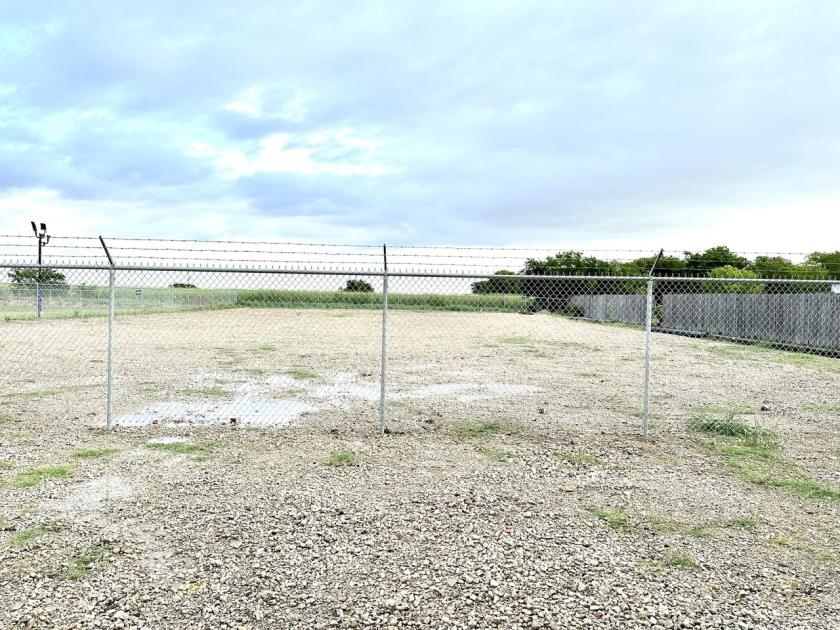
- • Fenced and Secure Storage Lot
- • Gravel yard
- • Ideal for auto or boat storage
- • Ideal for contractor yard
- • Great location in fast growing Prosper
Additional Photos

Listing Agents

Steve Burris
O: 214-682-4156
M: 214-682-4156
sburris@capstonecommercial.com
O: 214-682-4156
M: 214-682-4156
sburris@capstonecommercial.com
While we strive to provide the most accurate information, all listing information, and demographic data, is provided by third-parties. As such, MyEListing will not be responsible for the accuracy of the information. It is strongly recommended that you verify all information with the listing agent, and any relevant agencies, prior to making any decisions.