Industrial Properties
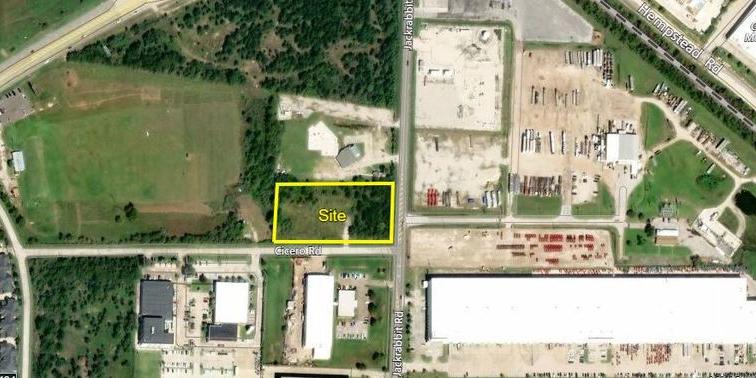
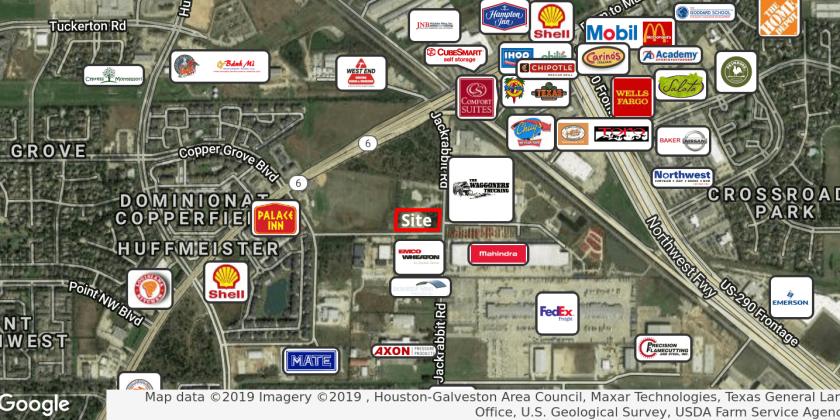
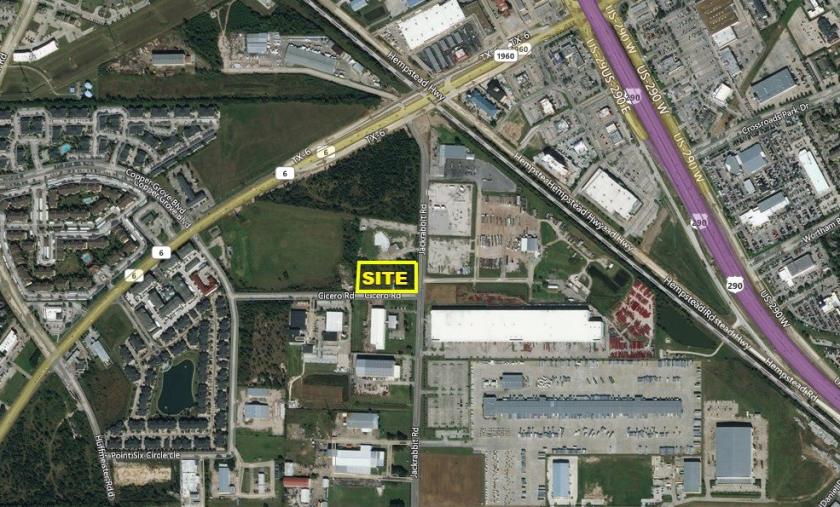
9201 Jackrabbit Road Houston, TX 77095
9201 Jackrabbit Road Houston, TX 77095
Details & Description
Property Highlights
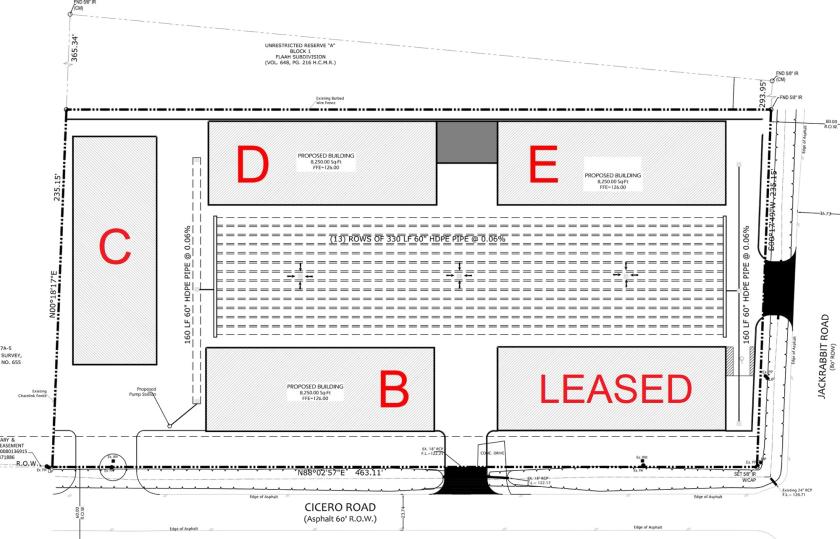
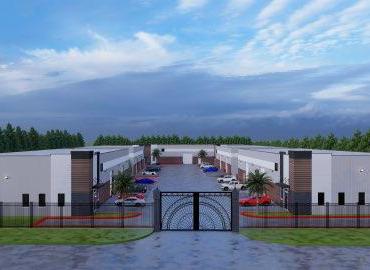
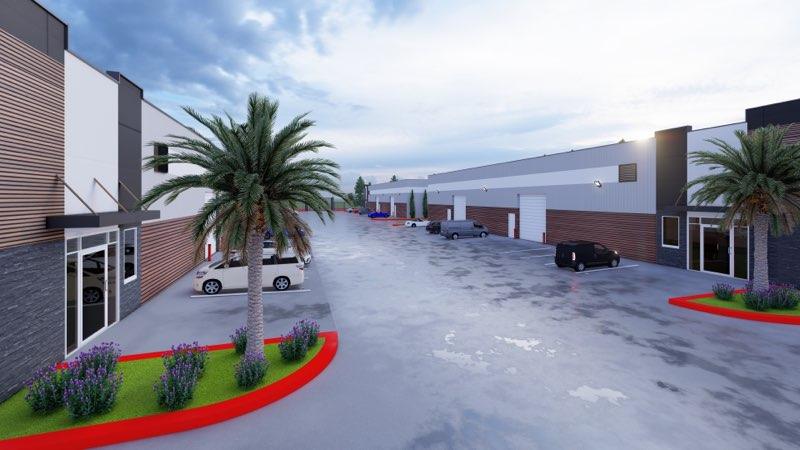
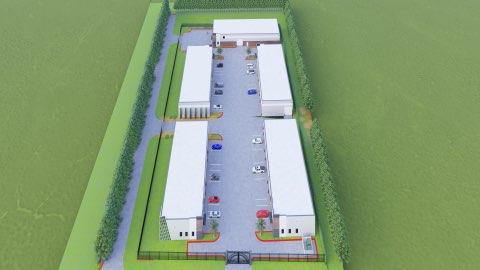
• Four free-standing build-to-suit office/warehouse buildings under construction for sale or lease
• Owner on site
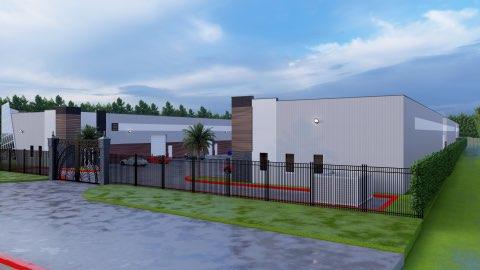
Additional Photos
Listing Agents

Alex Wisnoski
O: 713-473-7200
M: 281-415-1913
alex@texascres.com
O: 713-473-7200
M: 281-415-1913
alex@texascres.com
While we strive to provide the most accurate information, all listing information, and demographic data, is provided by third-parties. As such, MyEListing will not be responsible for the accuracy of the information. It is strongly recommended that you verify all information with the listing agent, and any relevant agencies, prior to making any decisions.