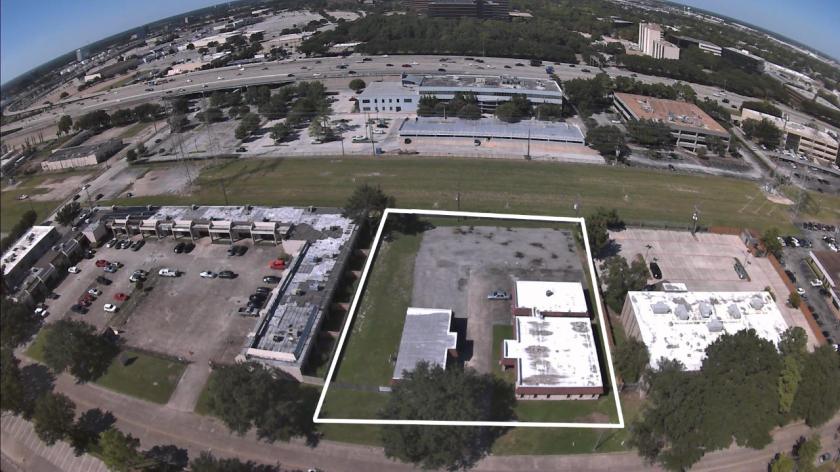
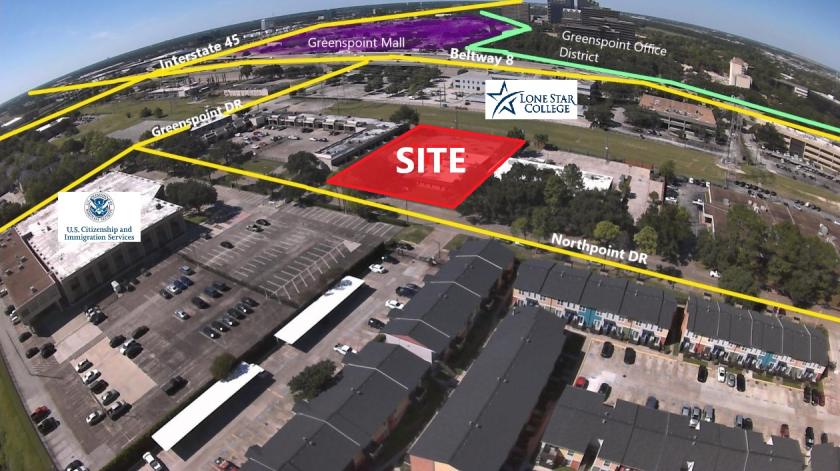
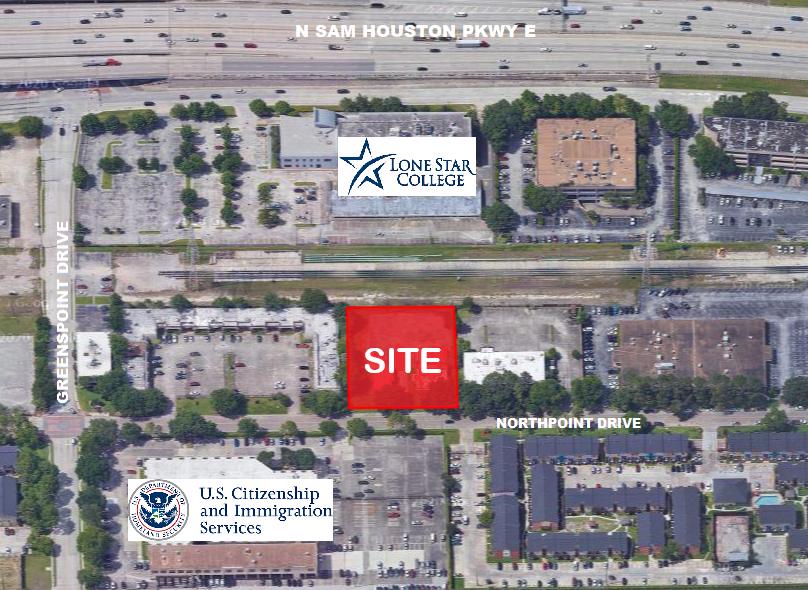
Commercial Land
131 Northpoint Drive Houston, TX 77060
131 Northpoint Drive Houston, TX 77060
Details & Description
Property Highlights
• Great redevelopment opportunity for office, retail, light industrial, and multi-family uses
• Situated in Harris County, City of Houston, North Houston District, and Aldine ISD
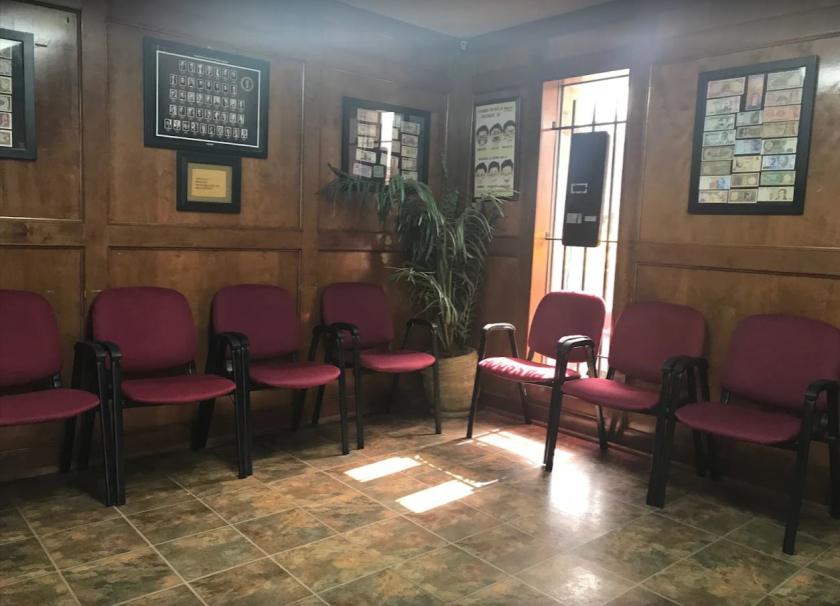
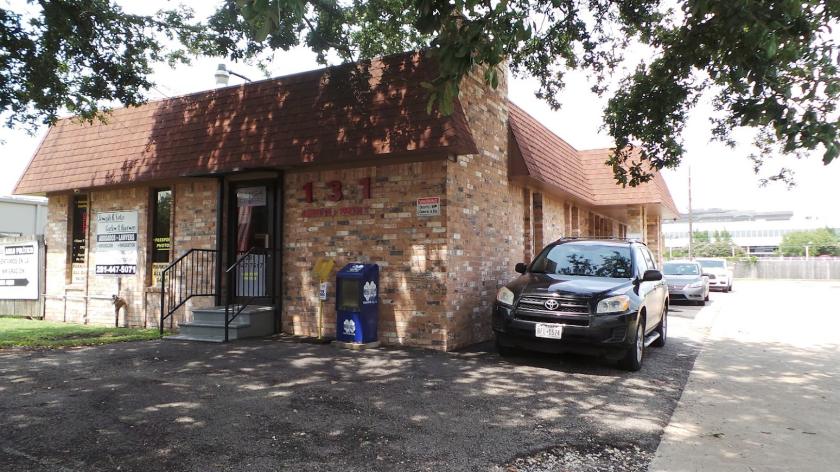
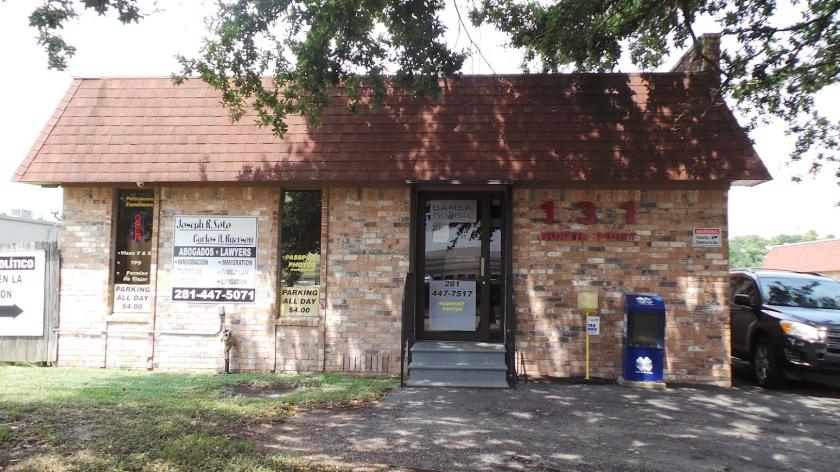
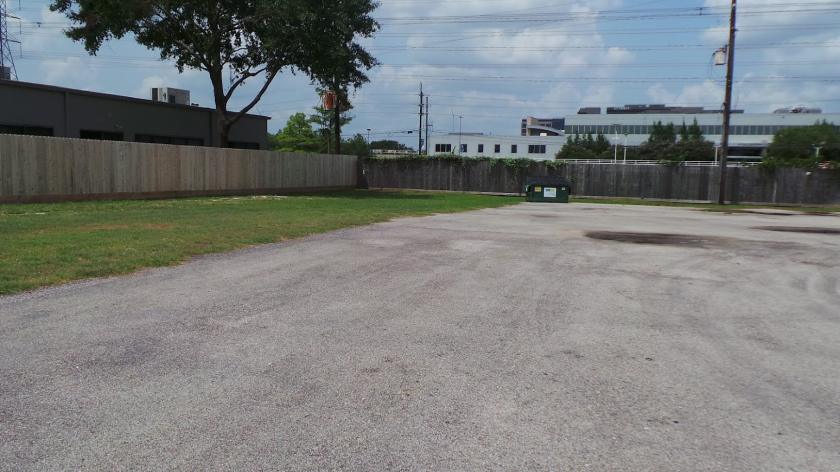
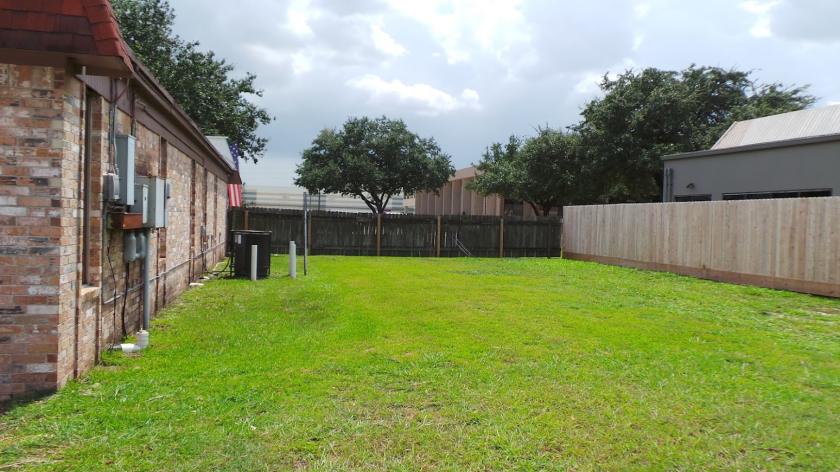
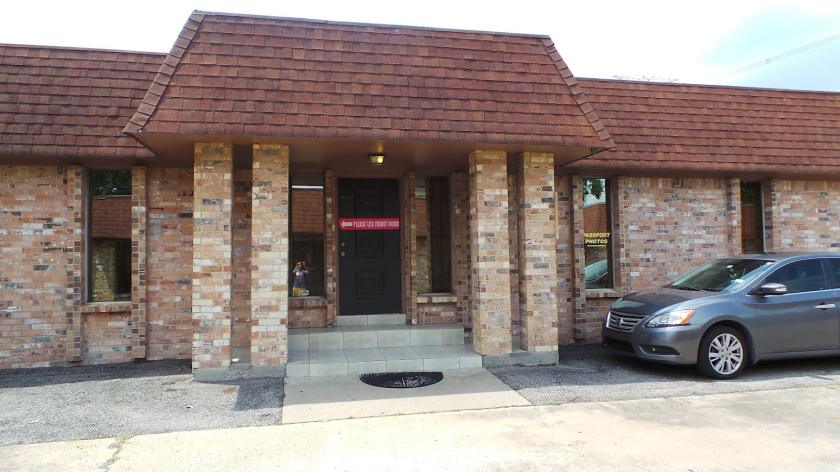
Additional Photos

Listing Agents

Alex Wisnoski
O: 713-473-7200
M: 281-415-1913
alex@texascres.com
O: 713-473-7200
M: 281-415-1913
alex@texascres.com
While we strive to provide the most accurate information, all listing information, and demographic data, is provided by third-parties. As such, MyEListing will not be responsible for the accuracy of the information. It is strongly recommended that you verify all information with the listing agent, and any relevant agencies, prior to making any decisions.