Commercial Land
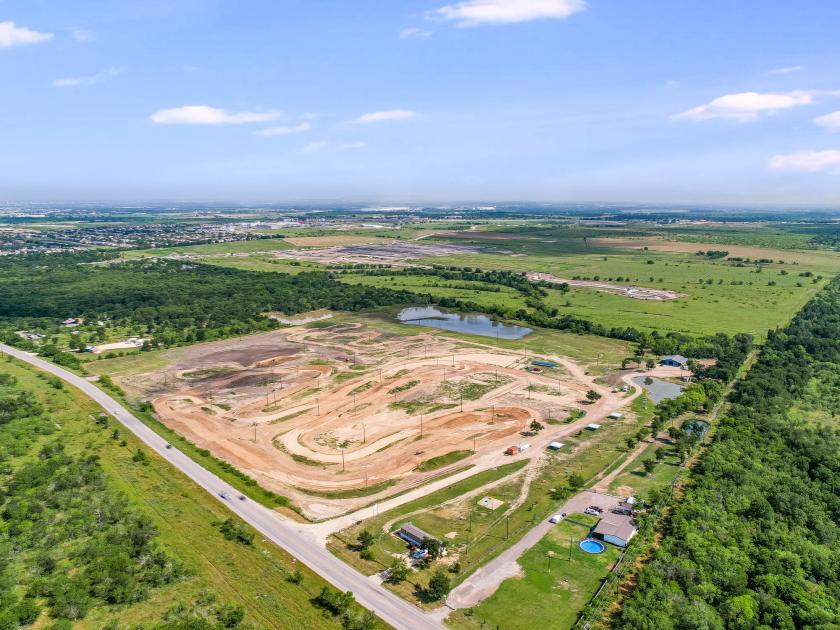
14600 Pearce Lane Del Valle, TX 78617
14600 Pearce Lane Del Valle, TX 78617

Details & Description
Property Highlights
- • Price: Contact Broker
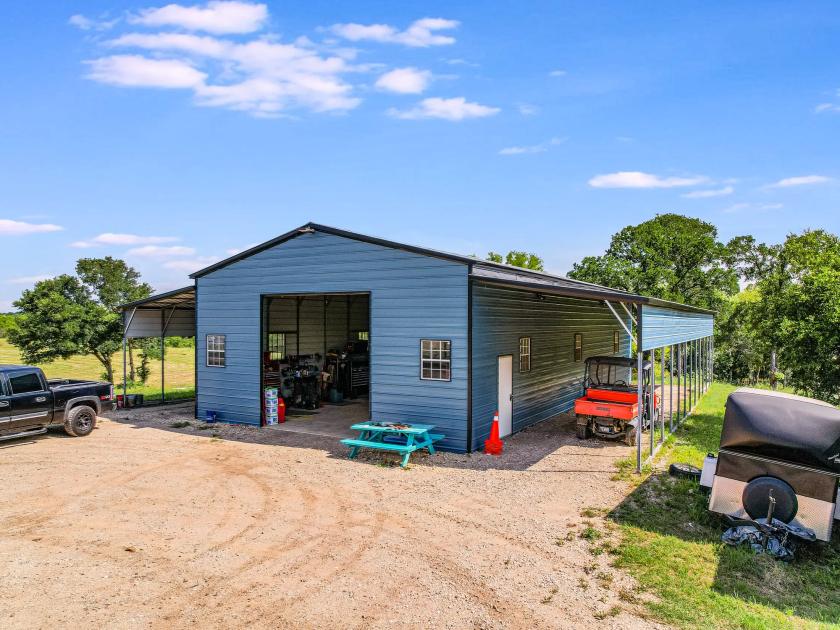
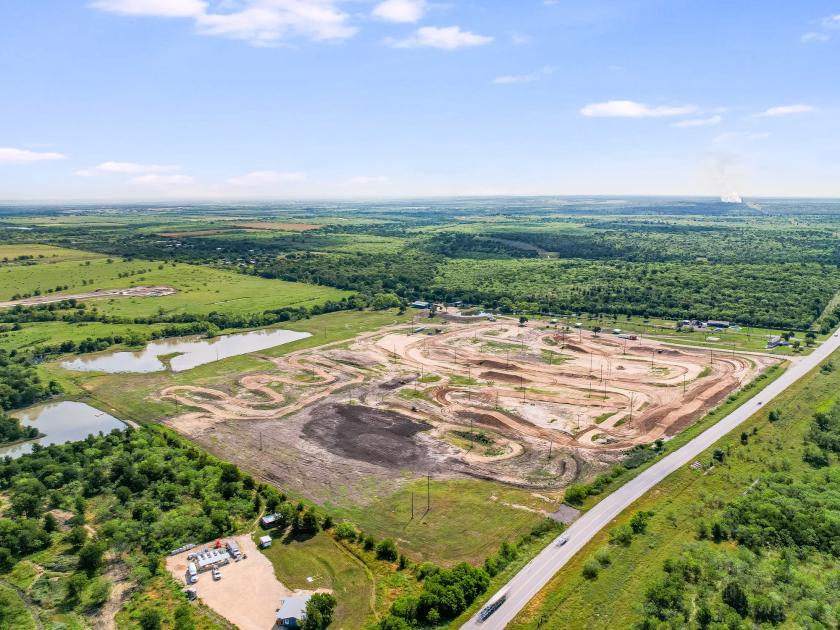
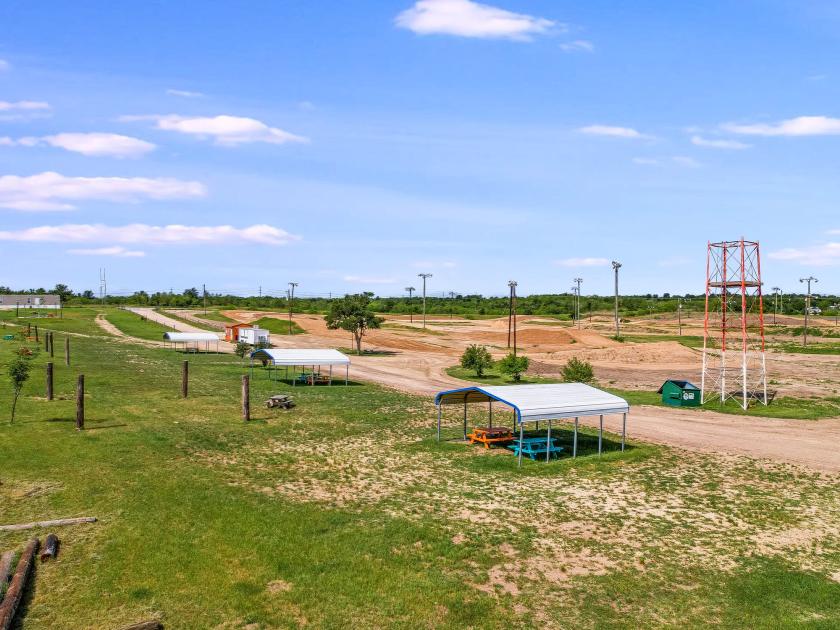
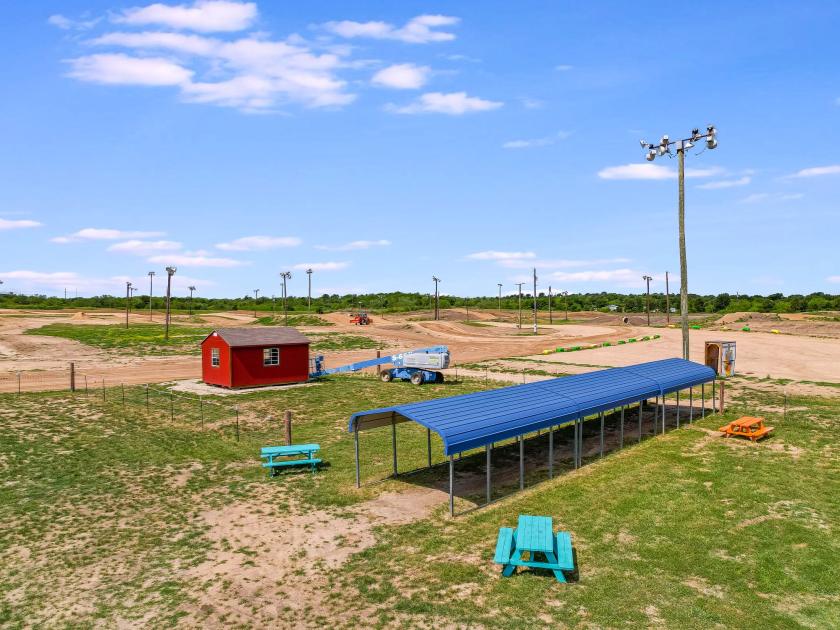
- • Asset Type: Land • Development
- • Owner/User, Developer or Investor Opportunity
- • Legal Description: ABS 18 NAVARRO J A ACR 45.948
- • Parcel ID: 0331410501
- • Lot Size: 45.948
Additional Photos


Listing Agents

Perry Horton
O: 512-467-2222
M: 512-415-4565
perry@leadcommercial.com
O: 512-467-2222
M: 512-415-4565
perry@leadcommercial.com
While we strive to provide the most accurate information, all listing information, and demographic data, is provided by third-parties. As such, MyEListing will not be responsible for the accuracy of the information. It is strongly recommended that you verify all information with the listing agent, and any relevant agencies, prior to making any decisions.