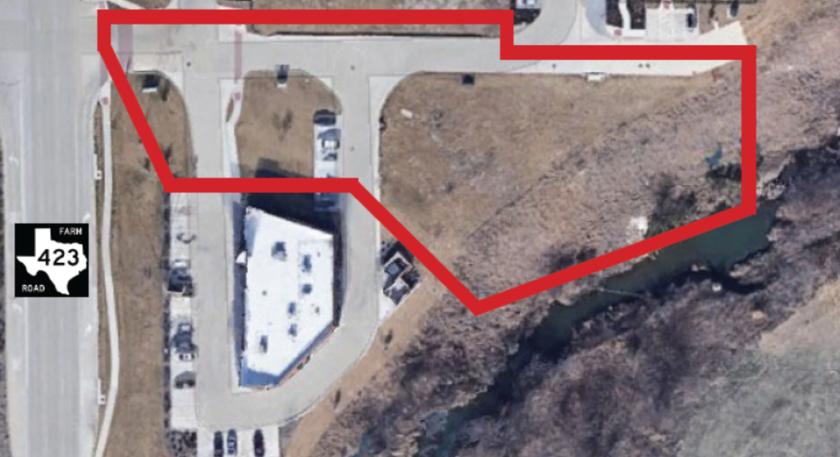
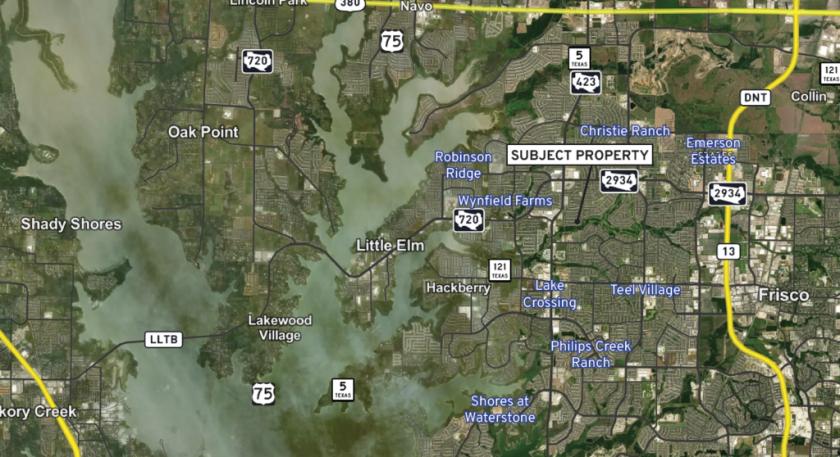
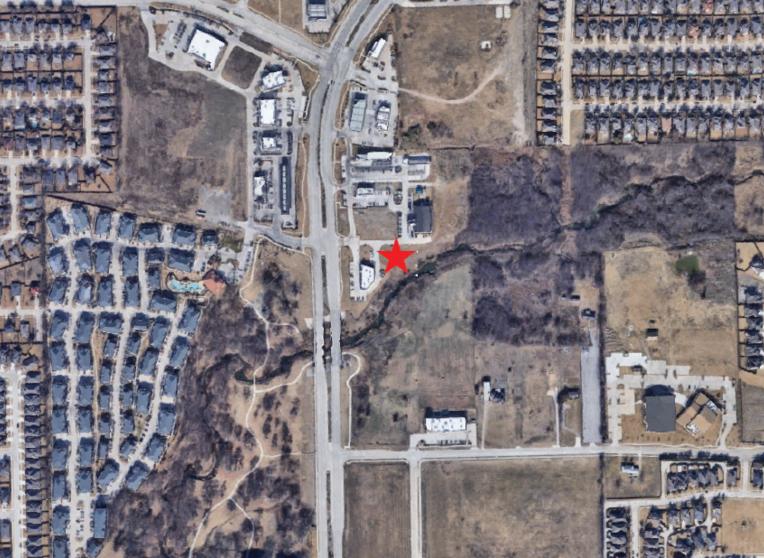
1-Mile | 3-Miles | 5-Miles | ||
---|---|---|---|---|
Total Population | 19,512 | 107,074 | 192,740 | |
Population Median Age | 35 | 34 | 34 | |
Population by Age | 0-9 Yrs | 2260 (11%) | 16622 (15%) | 30282 (15%) |
10-19 Yrs | 3539 (18%) | 19773 (18%) | 33131 (17%) | |
20-29 Yrs | 2328 (11%) | 8791 (8%) | 16974 (8%) | |
30-39 Yrs | 2853 (14%) | 16129 (15%) | 31083 (16%) | |
40-49 Yrs | 3995 (20%) | 22063 (20%) | 36592 (18%) | |
50-59 Yrs | 2255 (11%) | 10840 (10%) | 21228 (11%) | |
60-69 Yrs | 1153 (5%) | 6214 (5%) | 12376 (6%) | |
70+ Yrs | 1129 (5%) | 6641 (6%) | 11073 (5%) | |
Median HH Income | $113,857 | $122,106 | $115,917 | |
Total Household Income | < 24K | 301 (4%) | 2022 (6%) | 4501 (7%) |
25-49K | 583 (9%) | 2994 (9%) | 6501 (10%) | |
50-74K | 679 (10%) | 4008 (12%) | 7284 (11%) | |
75-99K | 987 (15%) | 3634 (10%) | 7180 (11%) | |
100-199K | 2856 (44%) | 12615 (38%) | 23798 (38%) | |
200K+ | 975 (15%) | 7781 (23%) | 12796 (20%) | |
Highest Education Level | No Diploma | 737 | 3562 | 6823 |
Diploma or GED | 1592 | 9688 | 18404 | |
Some College | 2763 | 12148 | 23717 | |
Assoc. Degree | 1131 | 4442 | 9086 | |
Bachelors Degree | 3594 | 21792 | 39882 | |
Higher Degree | 2626 | 14204 | 23050 | |
Total Housing Units | 6,570 | 34,292 | 64,946 | |
--Owner-Occupied | 4,236 | 26,974 | 47,615 | |
--Renter-Occupied | 2,144 | 6,079 | 14,446 | |
Owner-Occupied Values | < 100K | 75 | 830 | 1649 |
100-199K | 292 | 1458 | 3987 | |
200-299K | 1550 | 7431 | 13397 | |
300-399K | 1303 | 7403 | 11827 | |
400-499K | 508 | 4685 | 7535 | |
500K+ | 507 | 5168 | 9219 | |
Total Working Age Population | 14,931 | 76,481 | 139,651 | |
In Work Force | 11,260 | 54,657 | 101,815 | |
Not In Work Force | 3,671 | 21,824 | 37,836 | |
Workforce Employed | 10,918 | 52,488 | 97,767 | |
Workforce Unemployed | 336 | 2,161 | 3,980 | |
Civlian Workforce | 11,254 | 54,649 | 101,747 | |
Military Workforce | 5 | 8 | 68 | |
Total Households | 6,381 | 33,054 | 62,060 | |
Family Households | 5,009 | 27,564 | 48,863 | |
Non-Family Households | 1,371 | 5,490 | 13,198 | |
Married Couple | 3,669 | 23,519 | 40,846 | |
Other Family | 1,341 | 4,045 | 8,017 | |
Married w/Child | 2,138 | 14,941 | 25,033 | |
Single Male w/Child | 211 | 765 | 1,410 | |
Single Female w/Child | 716 | 1,941 | 3,703 |
Population Change Last Two Decades - Plus Projection
2000 | % | 2010 | % | 2020 | % | 2030 | |
---|---|---|---|---|---|---|---|
Texas | 20,851,820 | +21 | 25,145,561 | +18 | 29,677,668 | +18 | 34,894,452 |
Denton County | 432,976 | +53 | 662,614 | +36 | 897,953 | +37 | 1,234,110 |
Collin County | 491,675 | +59 | 782,341 | +33 | 1,039,369 | +34 | 1,391,461 |
Total Working Age Population:
Total Households:
Total Working Age Population:
Total Households:
Total Working Age Population:
Total Households: