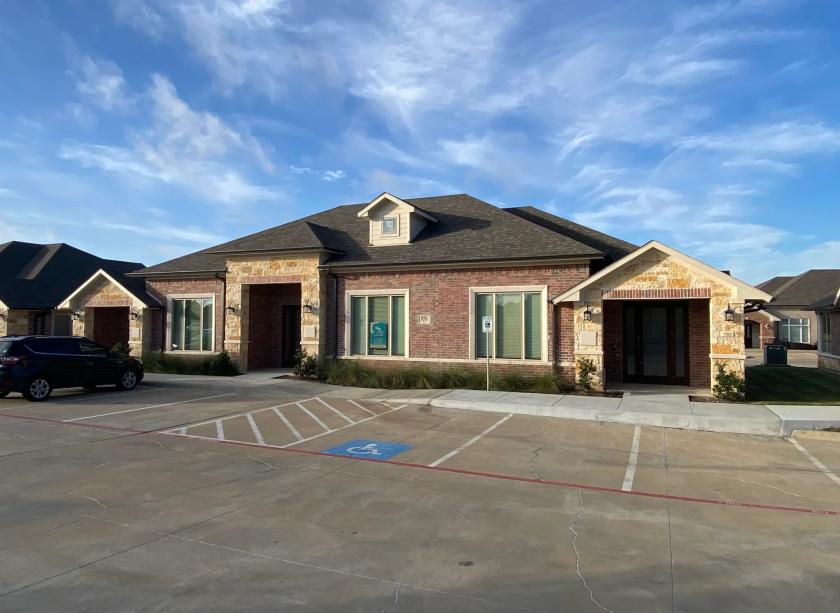
1-Mile | 3-Miles | 5-Miles | ||
---|---|---|---|---|
Total Population | 5,111 | 87,857 | 235,938 | |
Population Median Age | 33 | 35 | 36 | |
Population by Age | 0-9 Yrs | 674 (13%) | 11335 (12%) | 29512 (12%) |
10-19 Yrs | 403 (7%) | 11353 (12%) | 32717 (13%) | |
20-29 Yrs | 1428 (27%) | 14796 (16%) | 32287 (13%) | |
30-39 Yrs | 1015 (19%) | 15486 (17%) | 38685 (16%) | |
40-49 Yrs | 609 (11%) | 12310 (14%) | 35435 (15%) | |
50-59 Yrs | 513 (10%) | 12303 (14%) | 33861 (14%) | |
60-69 Yrs | 254 (4%) | 6165 (7%) | 19332 (8%) | |
70+ Yrs | 215 (4%) | 4109 (4%) | 14108 (5%) | |
Median HH Income | $66,548 | $77,749 | $85,883 | |
Total Household Income | < 24K | 230 (9%) | 2910 (8%) | 7310 (8%) |
25-49K | 598 (25%) | 6361 (19%) | 15016 (17%) | |
50-74K | 509 (21%) | 6683 (20%) | 15050 (17%) | |
75-99K | 486 (20%) | 5407 (16%) | 12609 (14%) | |
100-199K | 445 (19%) | 8305 (25%) | 25075 (29%) | |
200K+ | 60 (2%) | 3433 (10%) | 10671 (12%) | |
Highest Education Level | No Diploma | 165 | 4691 | 14834 |
Diploma or GED | 623 | 10975 | 28685 | |
Some College | 959 | 13106 | 31109 | |
Assoc. Degree | 351 | 4046 | 10578 | |
Bachelors Degree | 1102 | 18510 | 50024 | |
Higher Degree | 436 | 8826 | 25372 | |
Total Housing Units | 2,575 | 35,405 | 90,753 | |
--Owner-Occupied | 296 | 13,892 | 47,047 | |
--Renter-Occupied | 2,032 | 19,207 | 38,684 | |
Owner-Occupied Values | < 100K | 20 | 1033 | 2302 |
100-199K | 9 | 1601 | 6765 | |
200-299K | 144 | 4053 | 14538 | |
300-399K | 86 | 3672 | 10850 | |
400-499K | 24 | 1955 | 7140 | |
500K+ | 12 | 1578 | 5452 | |
Total Working Age Population | 4,242 | 69,588 | 186,057 | |
In Work Force | 3,550 | 53,854 | 138,423 | |
Not In Work Force | 693 | 15,735 | 47,634 | |
Workforce Employed | 3,332 | 51,564 | 133,534 | |
Workforce Unemployed | 206 | 2,259 | 4,753 | |
Civlian Workforce | 3,538 | 53,823 | 138,287 | |
Military Workforce | 12 | 31 | 136 | |
Total Households | 2,327 | 33,099 | 85,731 | |
Family Households | 1,084 | 21,345 | 58,893 | |
Non-Family Households | 1,243 | 11,754 | 26,838 | |
Married Couple | 625 | 15,935 | 46,110 | |
Other Family | 459 | 5,409 | 12,783 | |
Married w/Child | 258 | 7,519 | 22,245 | |
Single Male w/Child | 52 | 694 | 1,416 | |
Single Female w/Child | 216 | 2,427 | 5,780 |
Population Change Last Two Decades - Plus Projection
2000 | % | 2010 | % | 2020 | % | 2030 | |
---|---|---|---|---|---|---|---|
Texas | 20,851,820 | +21 | 25,145,561 | +18 | 29,677,668 | +18 | 34,894,452 |
Tarrant County | 1,446,219 | +25 | 1,809,034 | +19 | 2,143,755 | +17 | 2,507,170 |
Denton County | 432,976 | +53 | 662,614 | +36 | 897,953 | +37 | 1,234,110 |
Dallas County | 2,218,899 | +7 | 2,368,139 | +15 | 2,734,111 | +14 | 3,106,298 |
Total Working Age Population:
Total Households:
Total Working Age Population:
Total Households:
Total Working Age Population:
Total Households: