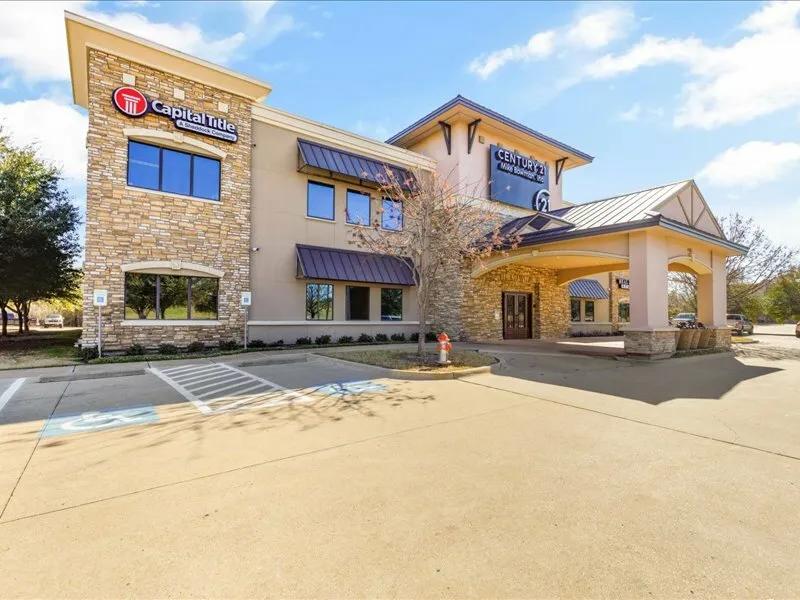
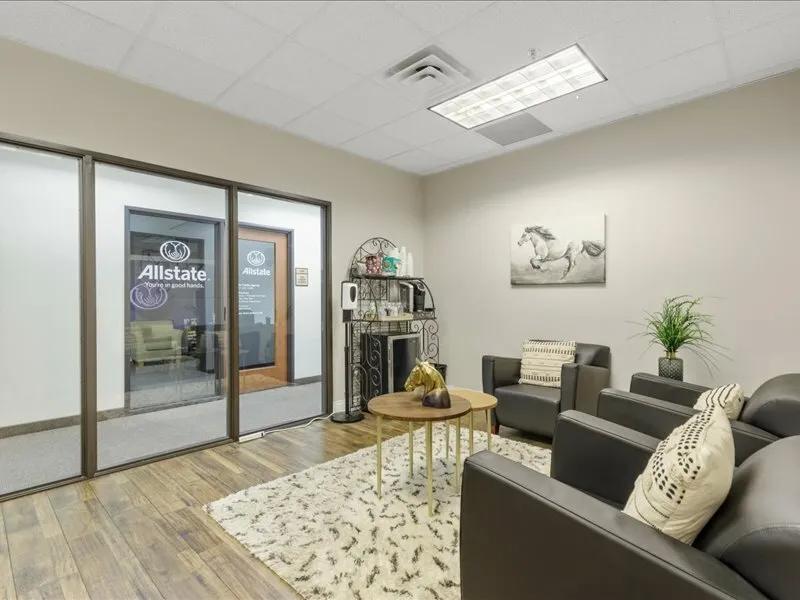
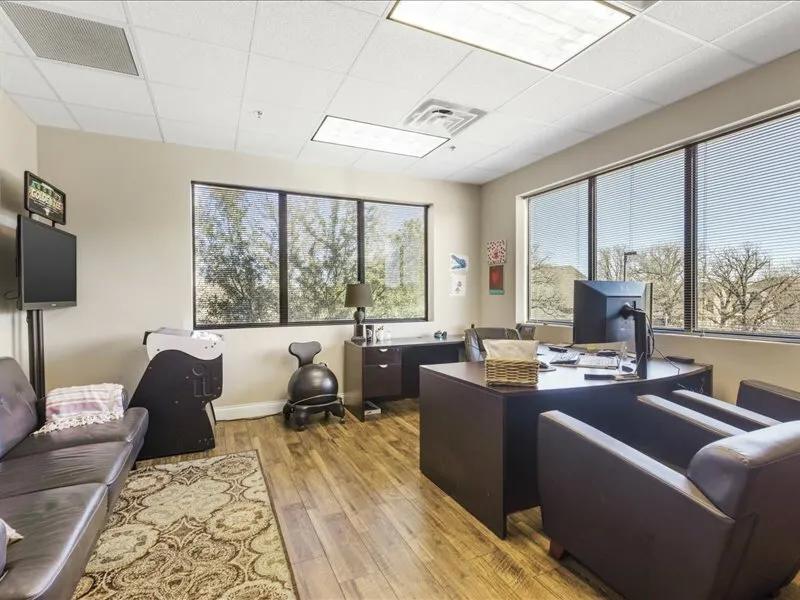
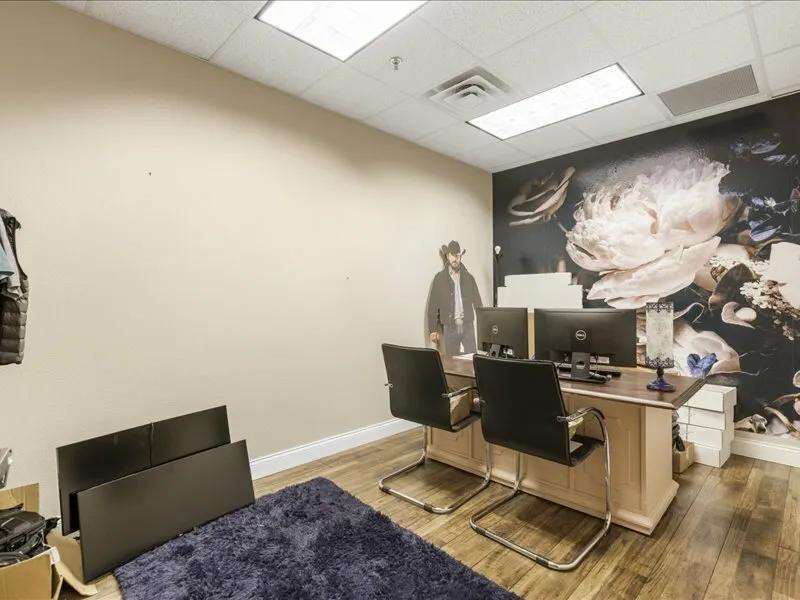
Office Space
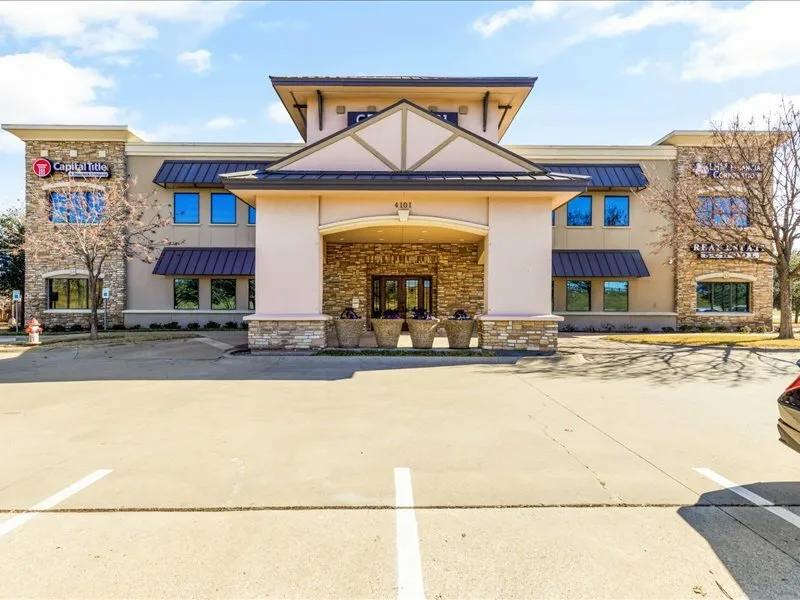
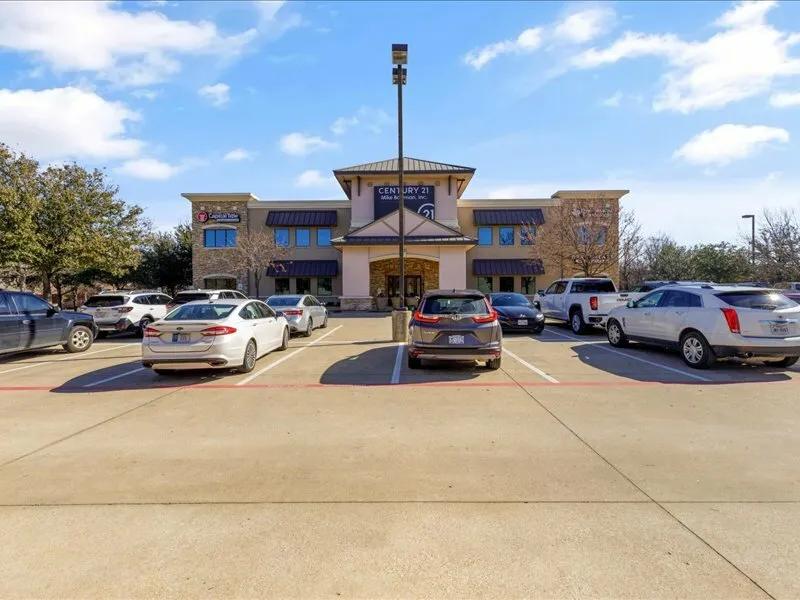
4101 William D Tate Avenue Grapevine, TX 76051
4101 William D Tate Avenue Grapevine, TX 76051
Details & Description
Property Highlights
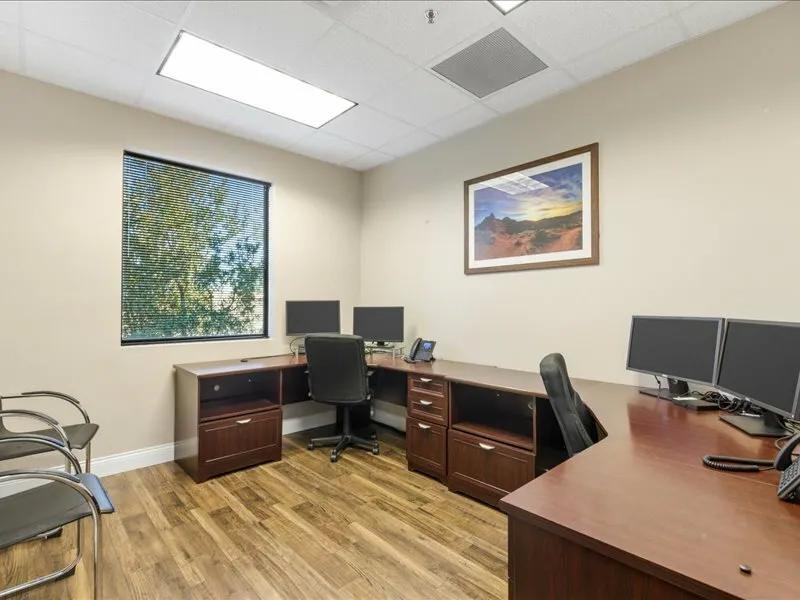
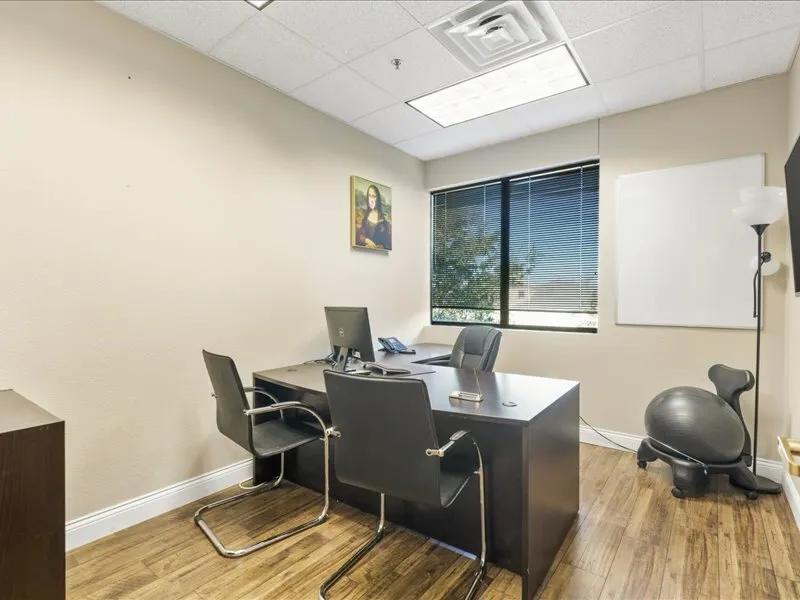
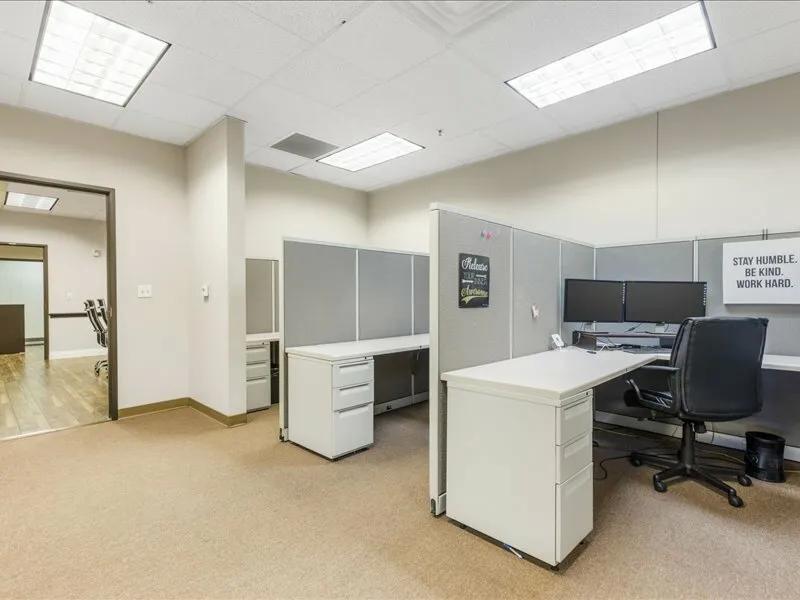
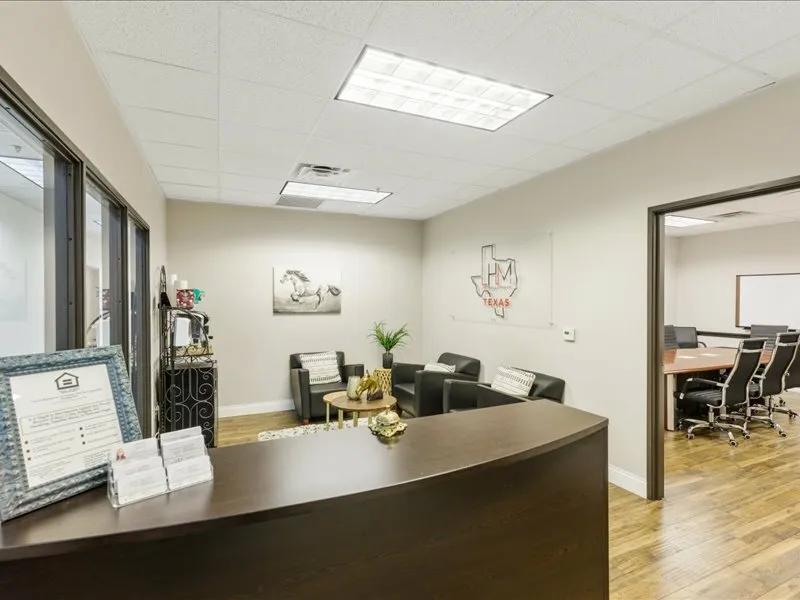
- • Professional Office Space
- • 2nd Generation
- • Move-In Ready suite
- • Sublease expires 6/30/2027
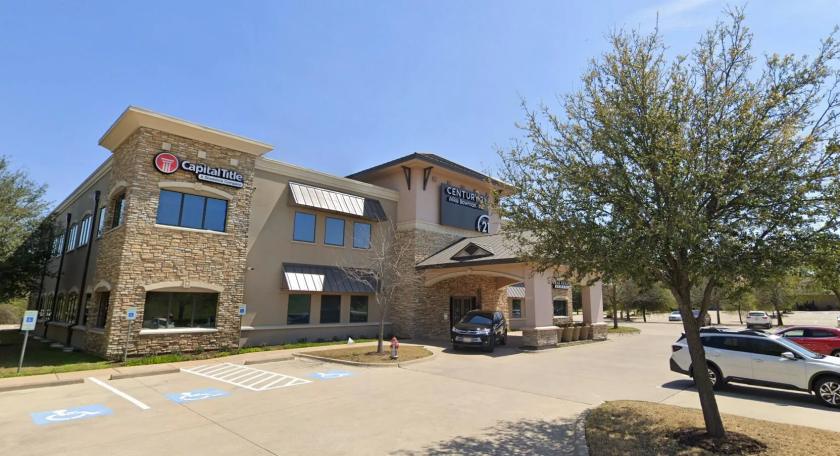
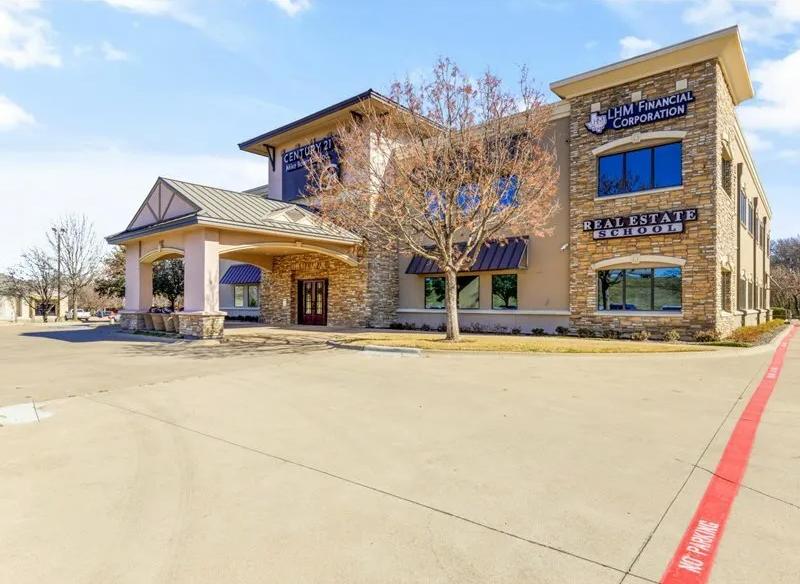
- • Building/Monument Signage
- • Parking ratio: 4/1000
Additional Photos
Listing Agents

Eric Goodwin
O: 817-488-4333
M: 214-642-8928
eric@championsdfw.com
O: 817-488-4333
M: 214-642-8928
eric@championsdfw.com

Grant Goodwin
O: 817-488-4333
grant@championsdfw.com
O: 817-488-4333
grant@championsdfw.com

Jim Kelley
O: 817-488-4333
M: 817-909-7875
jim@championsdfw.com
O: 817-488-4333
M: 817-909-7875
jim@championsdfw.com
While we strive to provide the most accurate information, all listing information, and demographic data, is provided by third-parties. As such, MyEListing will not be responsible for the accuracy of the information. It is strongly recommended that you verify all information with the listing agent, and any relevant agencies, prior to making any decisions.