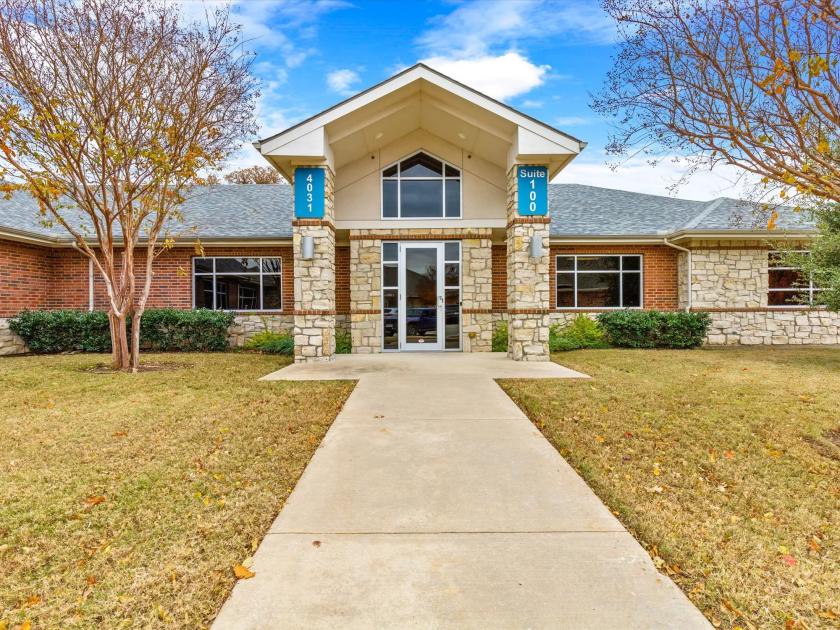
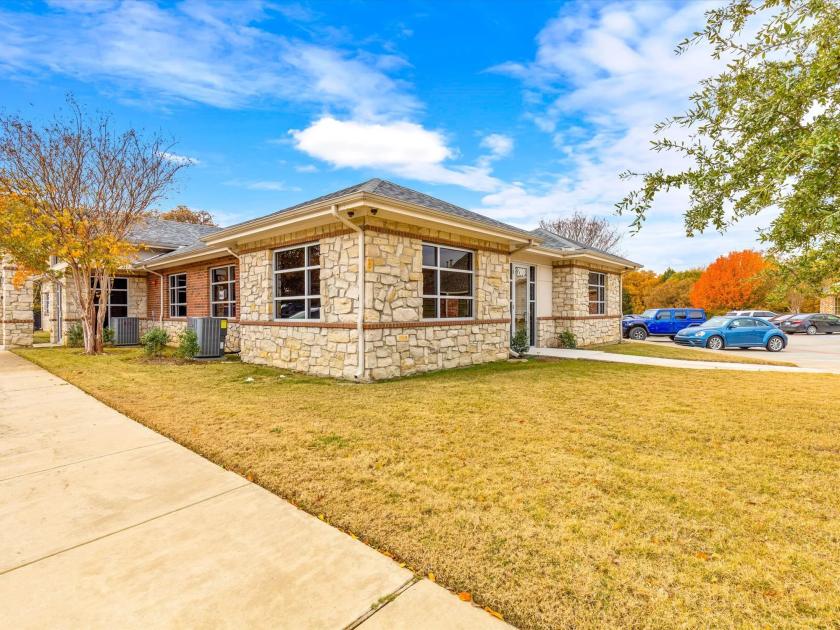
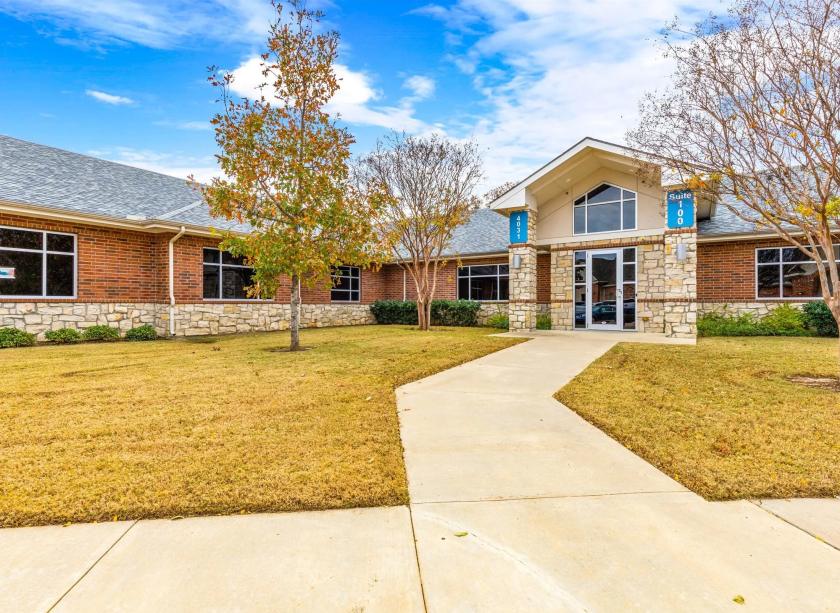
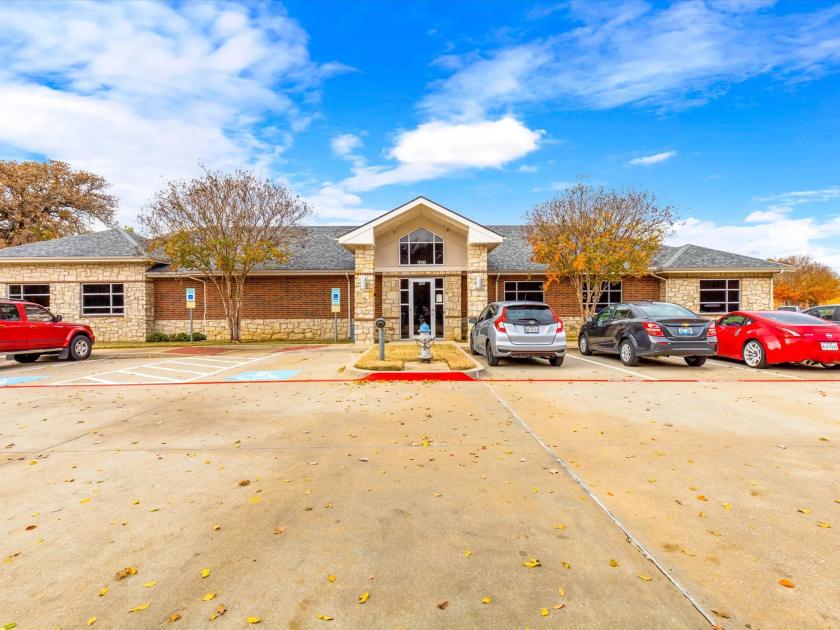
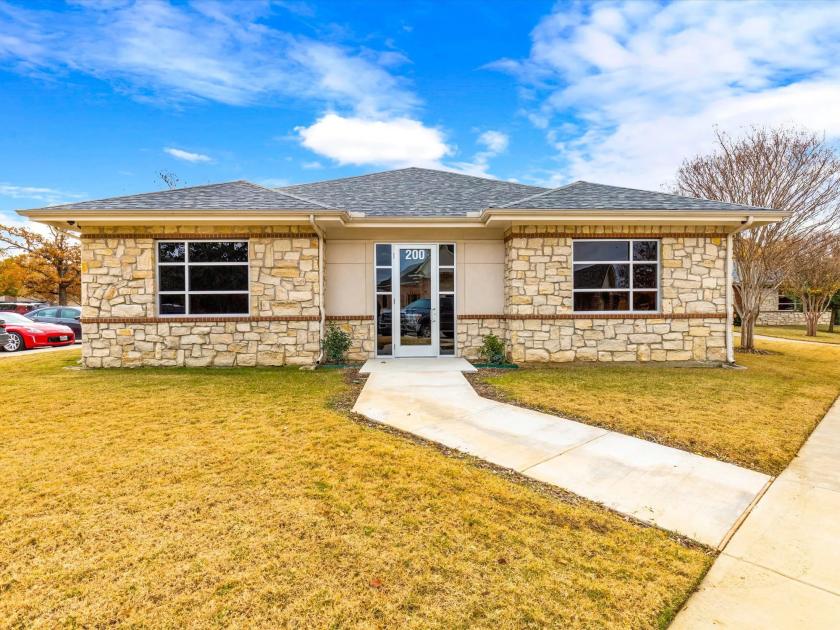
Office Space
4031 Kirkpatrick Lane Flower Mound, TX 75028
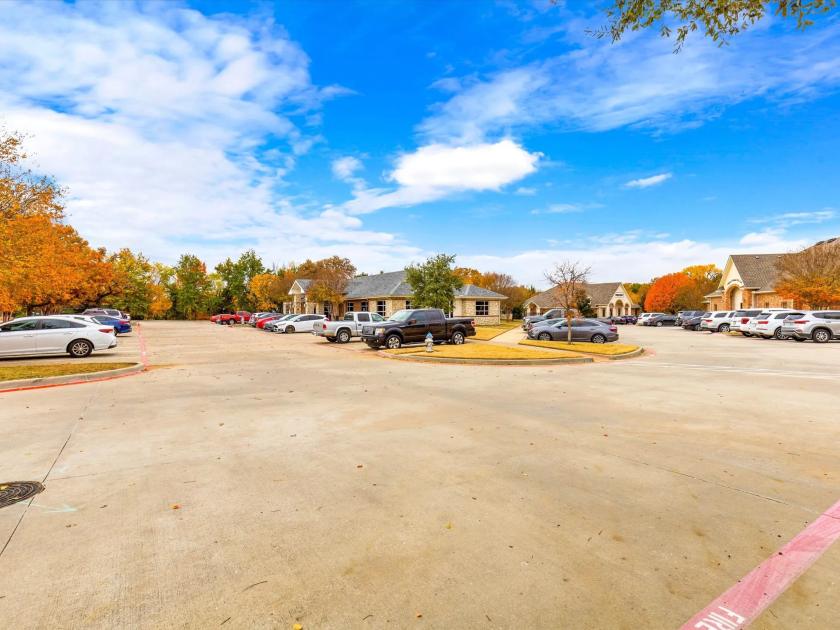
4031 Kirkpatrick Lane Flower Mound, TX 75028
Details & Description
Property Highlights
- • Lease Rate: $19.00 - 21.00 SF/yr (MG)
- • Located at FM 117 & Kirkpatrick Lane
- • Delivered White Box
- • Tenant Improvement Allowance
- • Flexible Space Plans
- • Strong Flower Mound Demographics
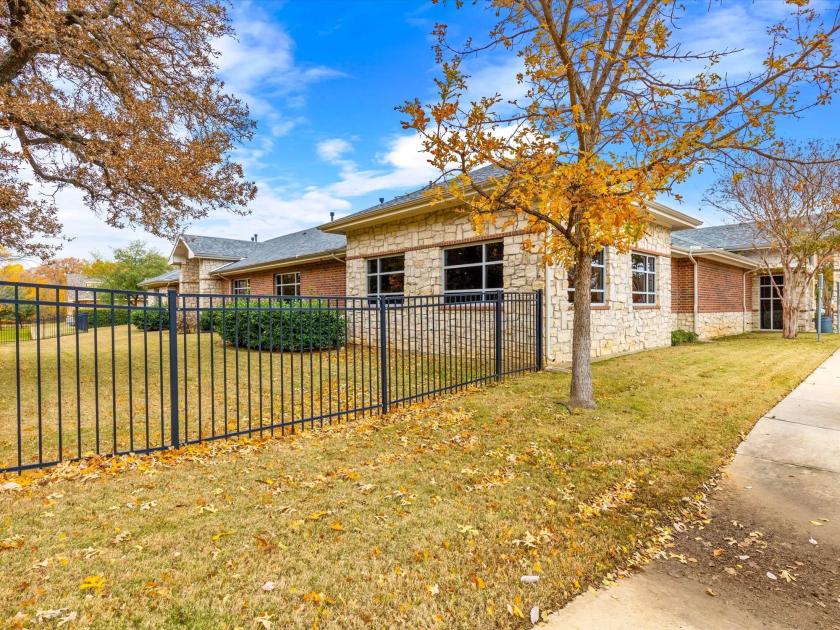
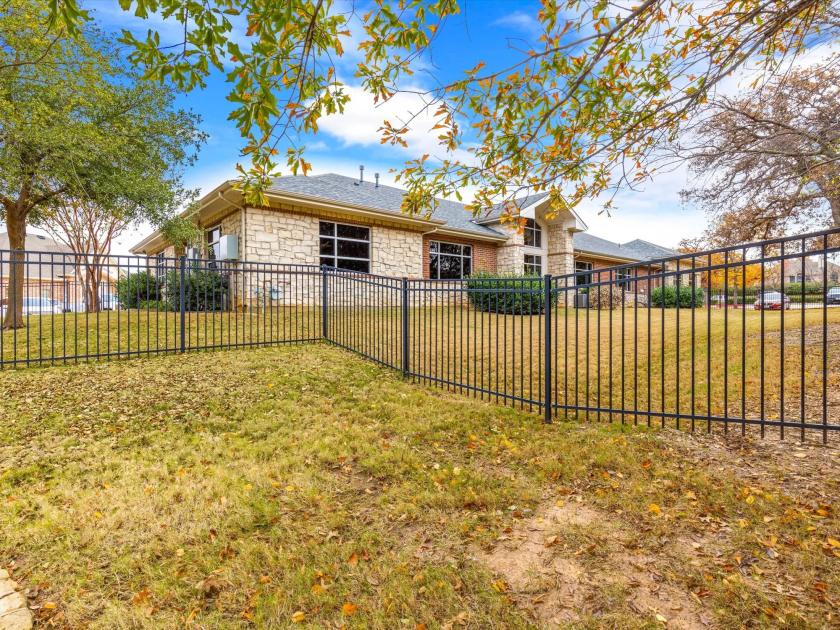
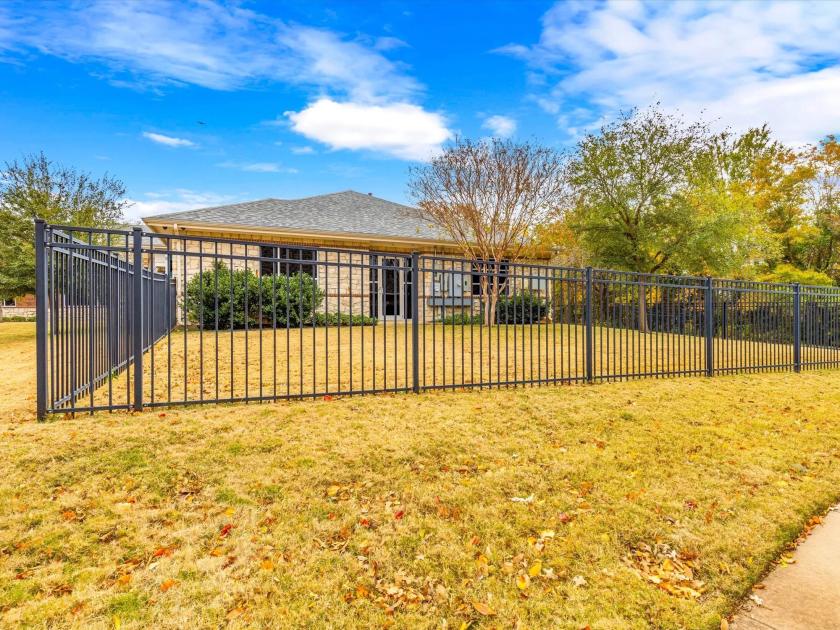
Additional Photos

Listing Agents

Eric Goodwin
O: 817-488-4333
M: 214-642-8928
eric@championsdfw.com
O: 817-488-4333
M: 214-642-8928
eric@championsdfw.com

Grant Goodwin
O: 817-488-4333
grant@championsdfw.com
O: 817-488-4333
grant@championsdfw.com

Jim Kelley
O: 817-488-4333
M: 817-909-7875
jim@championsdfw.com
O: 817-488-4333
M: 817-909-7875
jim@championsdfw.com
While we strive to provide the most accurate information, all listing information, and demographic data, is provided by third-parties. As such, MyEListing will not be responsible for the accuracy of the information. It is strongly recommended that you verify all information with the listing agent, and any relevant agencies, prior to making any decisions.