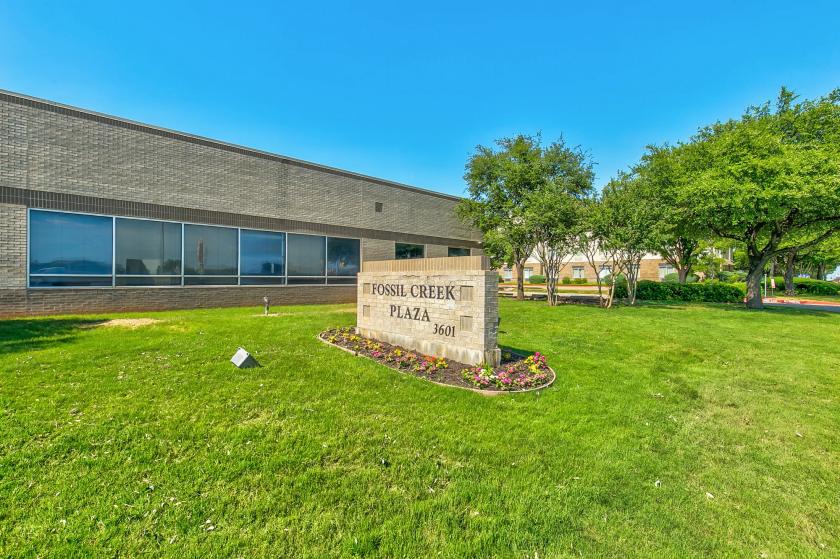
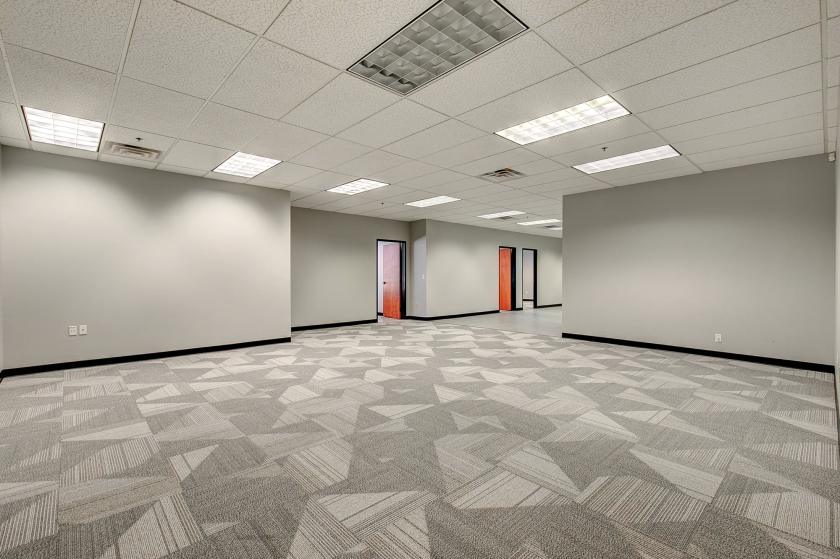
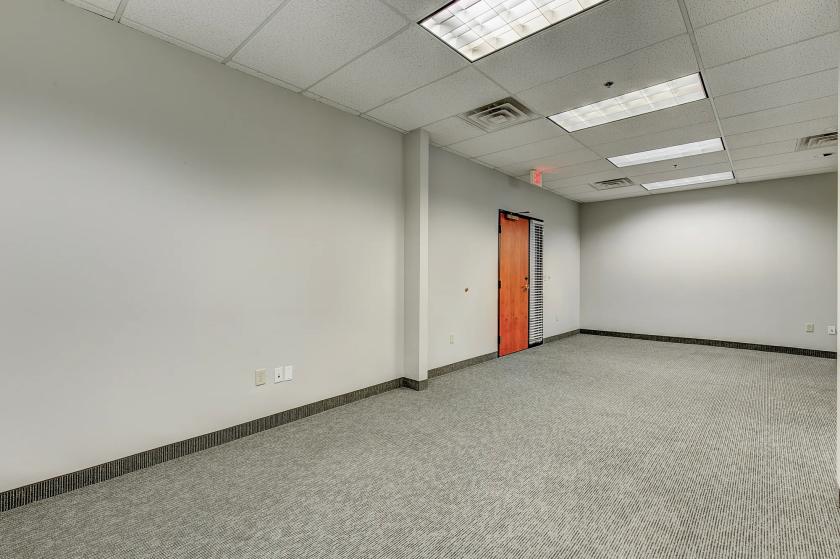
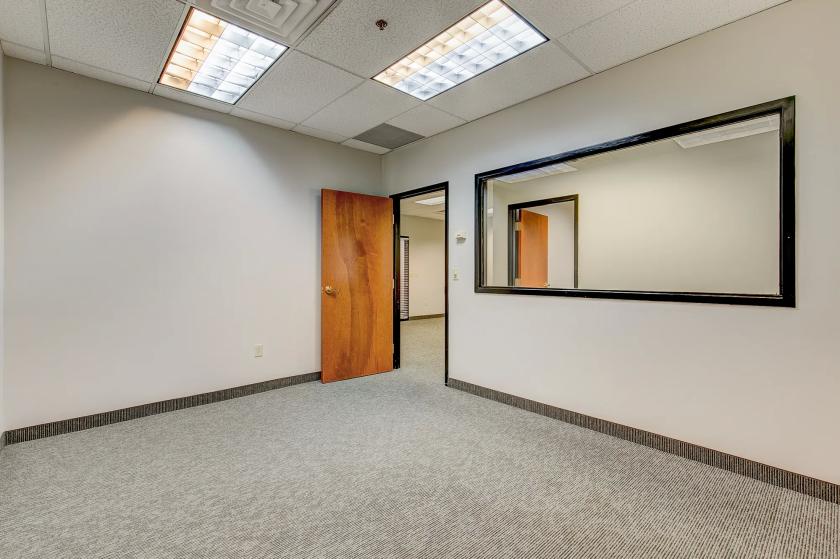
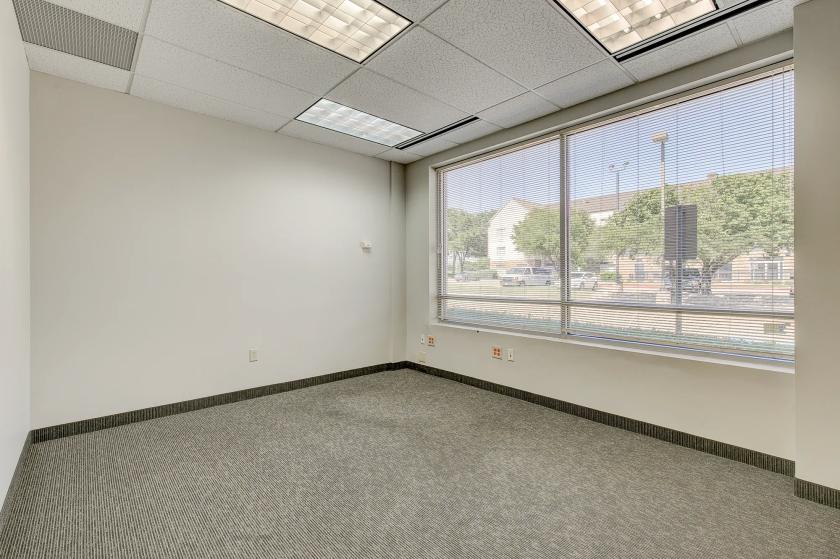
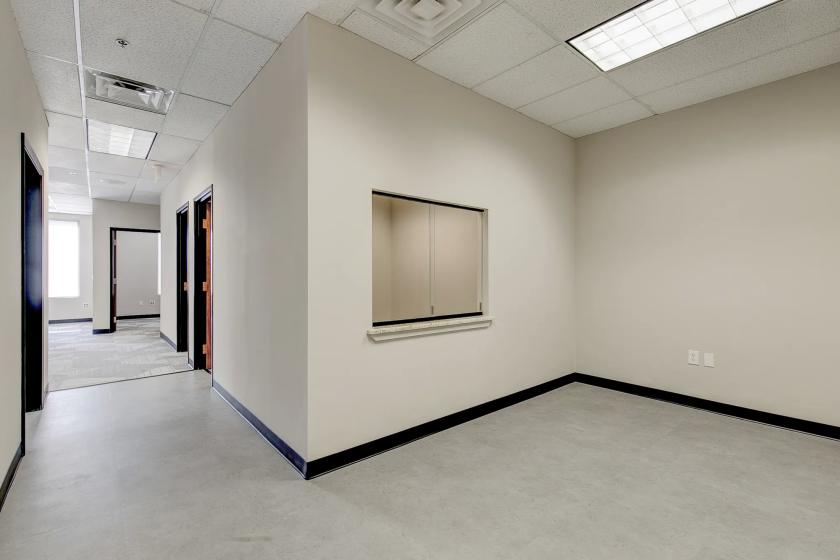
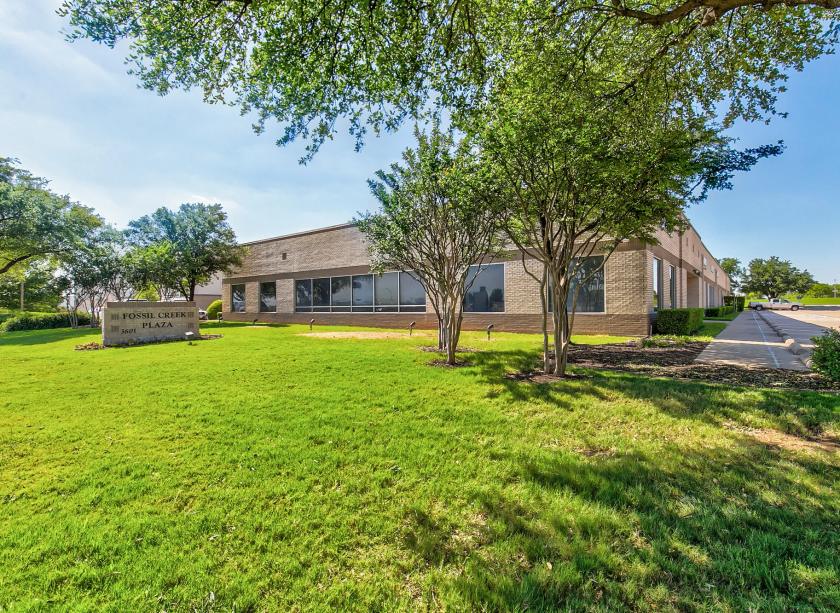
Office Space
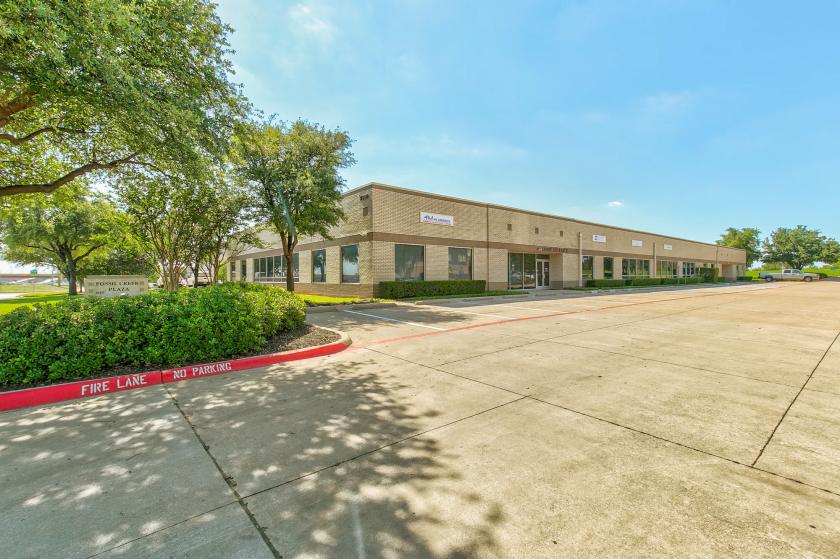
3601 Northeast Loop 820 Fort Worth, TX 76137
3601 Northeast Loop 820 Fort Worth, TX 76137
Details & Description
Property Highlights
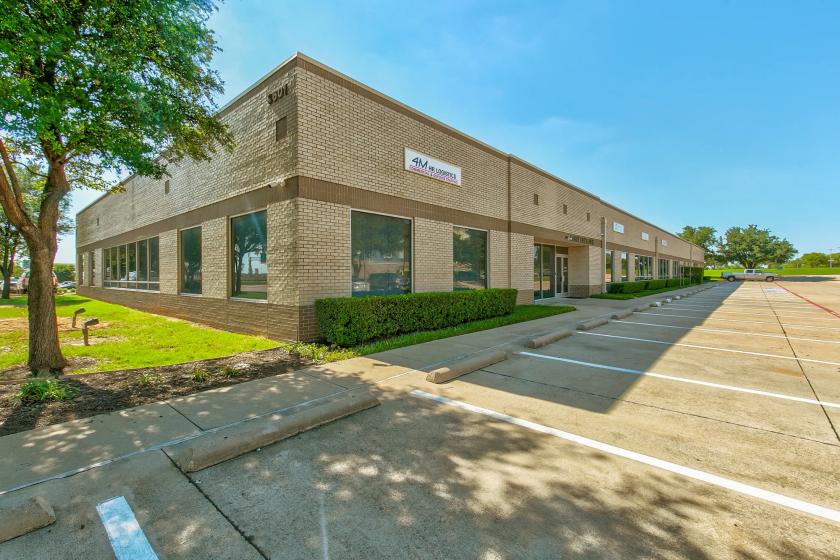
• N Fort Worth/Alliance Professional Office Space For Lease. Near NE Loop 820 & Beach
• Minutes from Downtown Fort Worth/DFW Int'l Airport
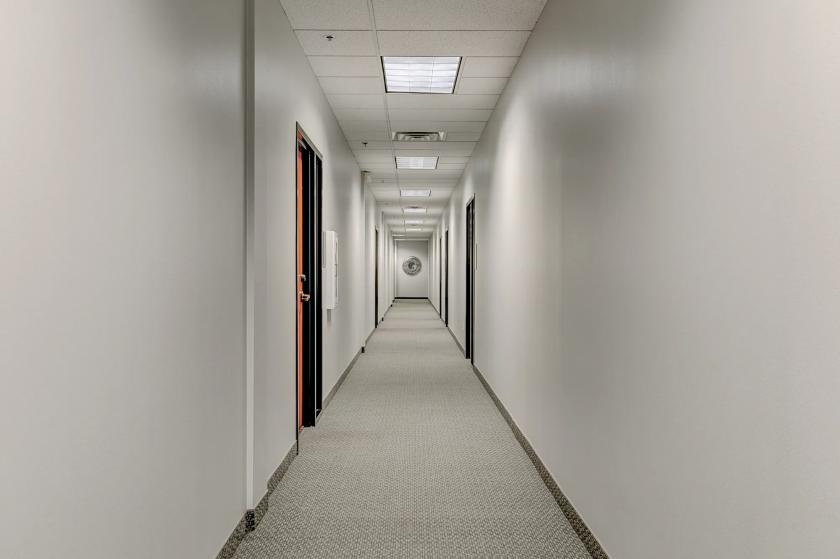
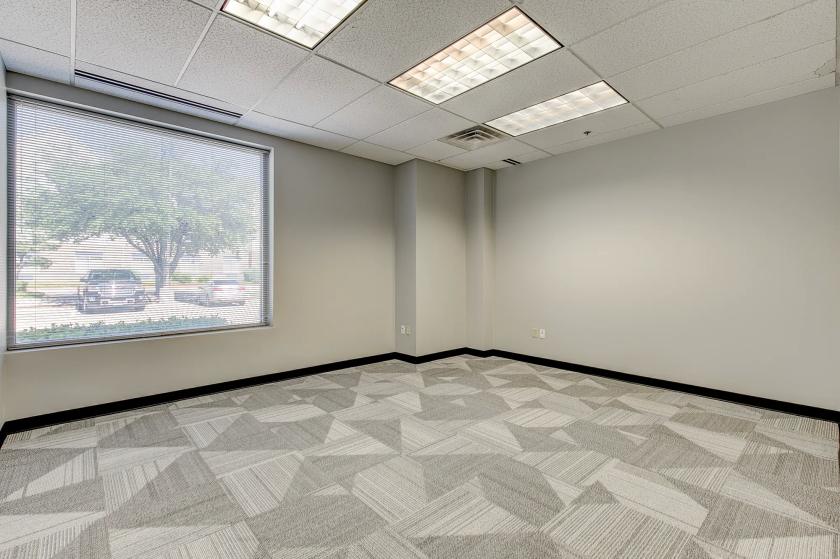
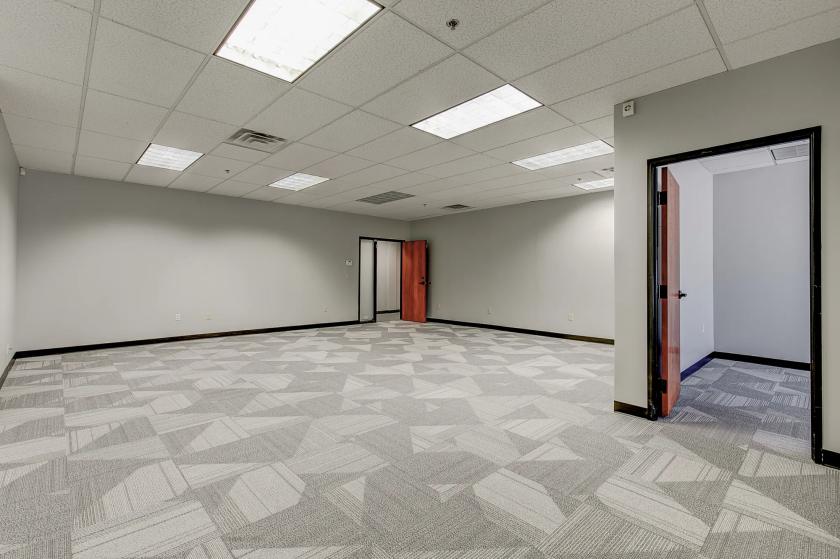
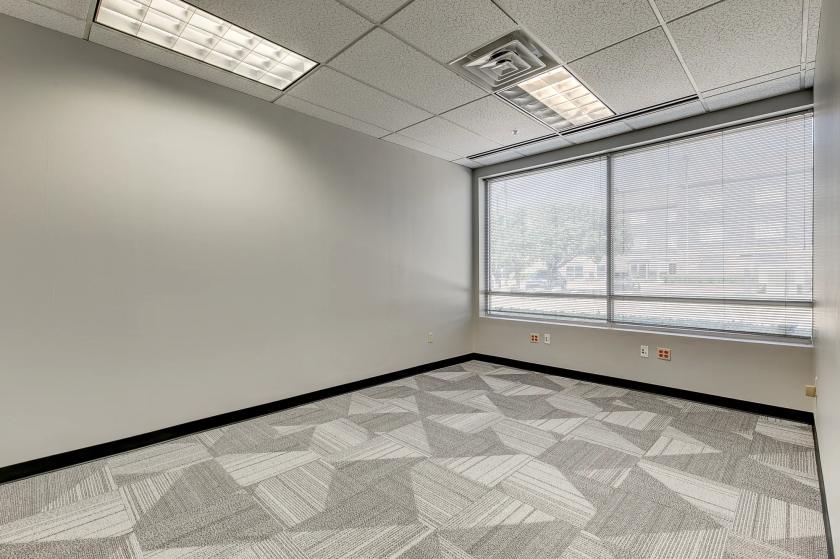
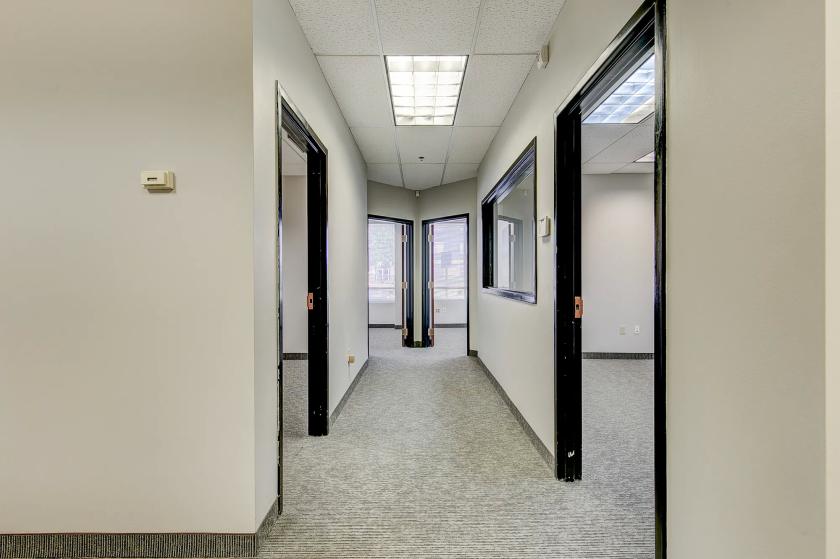
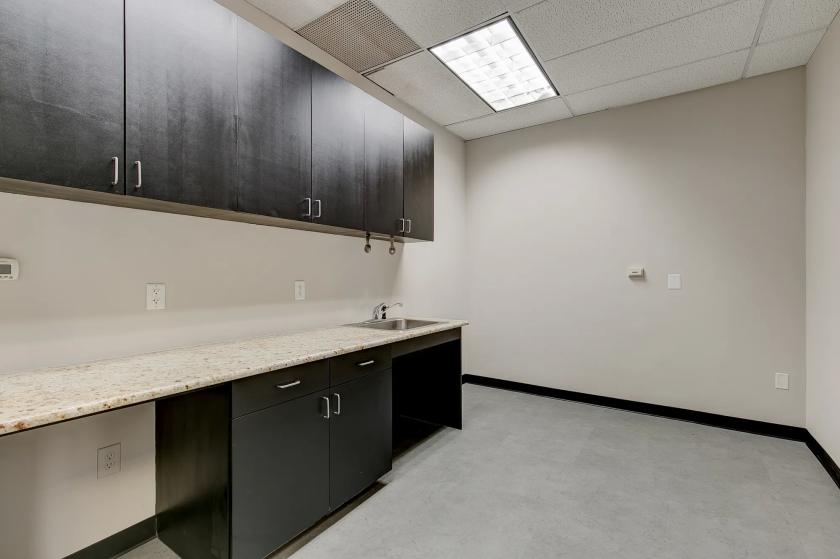
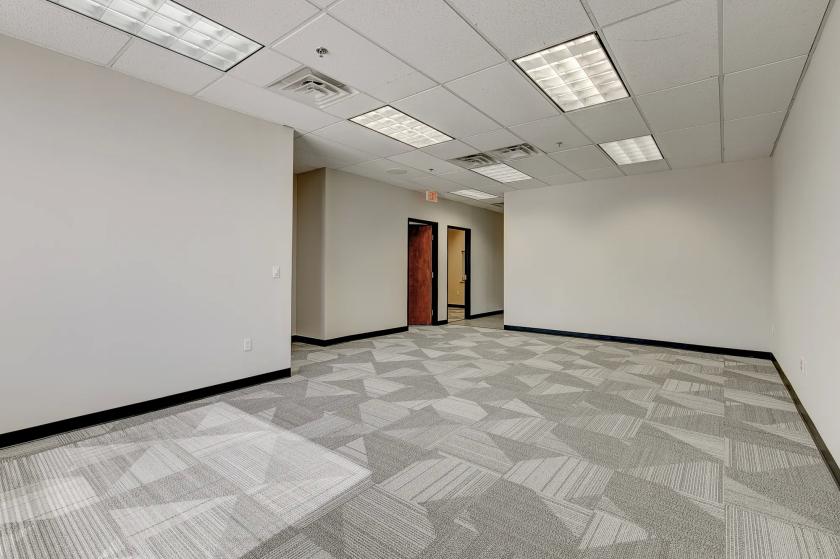
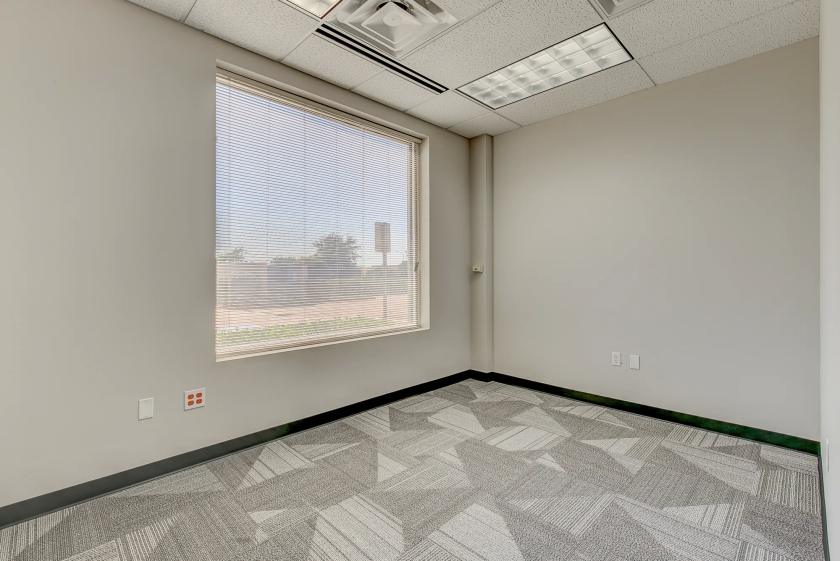
Additional Photos
Listing Agents

Eric Goodwin
O: 817-488-4333
M: 214-642-8928
eric@championsdfw.com
O: 817-488-4333
M: 214-642-8928
eric@championsdfw.com

Jim Kelley
O: 817-488-4333
M: 817-909-7875
jim@championsdfw.com
O: 817-488-4333
M: 817-909-7875
jim@championsdfw.com
While we strive to provide the most accurate information, all listing information, and demographic data, is provided by third-parties. As such, MyEListing will not be responsible for the accuracy of the information. It is strongly recommended that you verify all information with the listing agent, and any relevant agencies, prior to making any decisions.