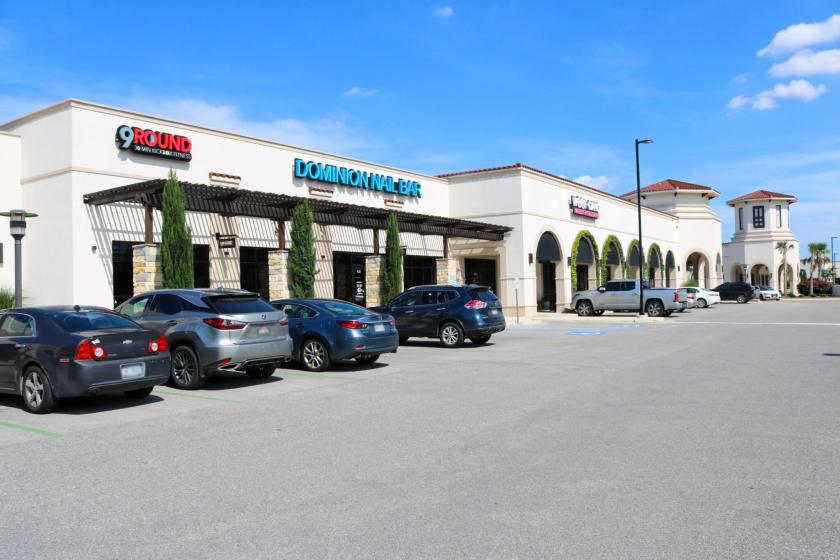
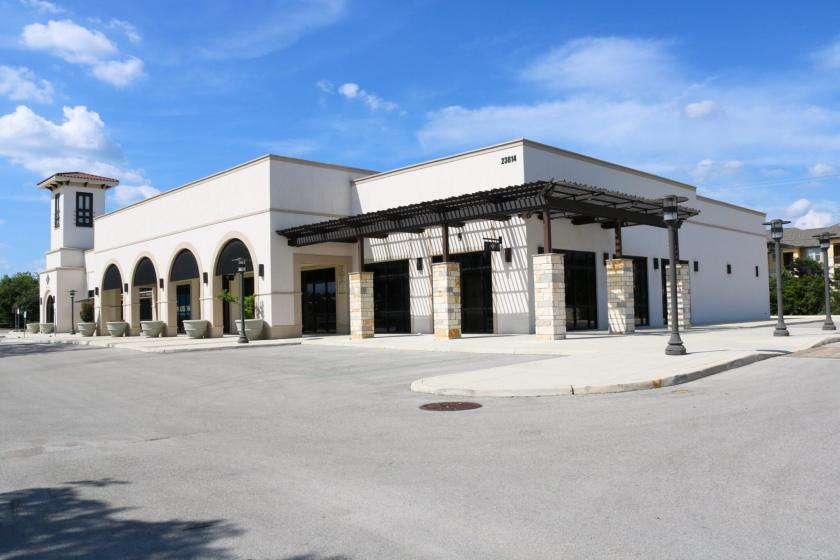
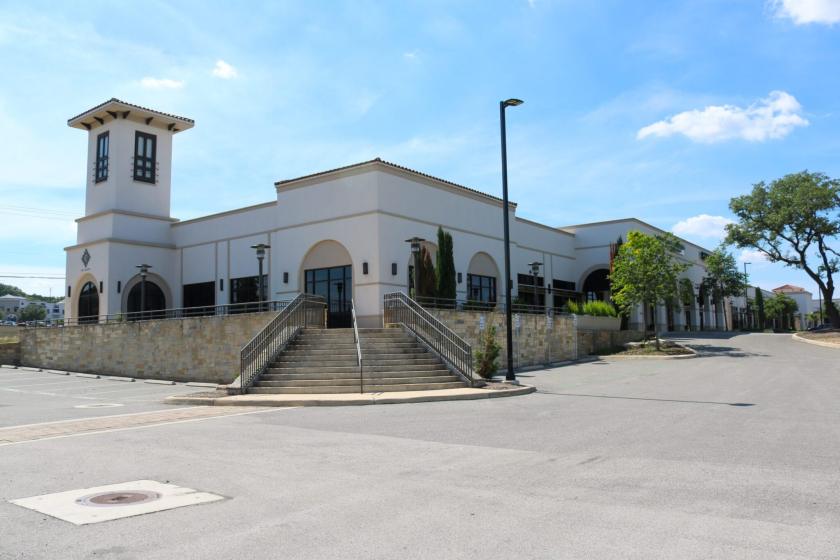
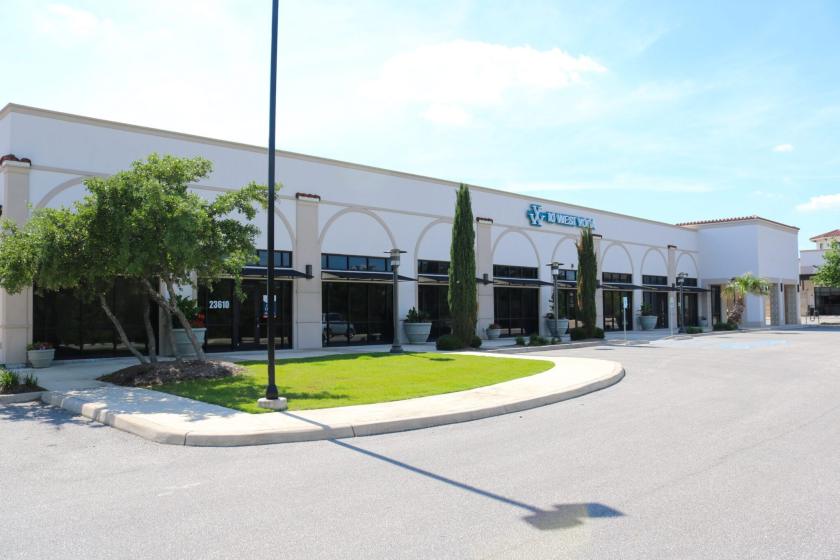
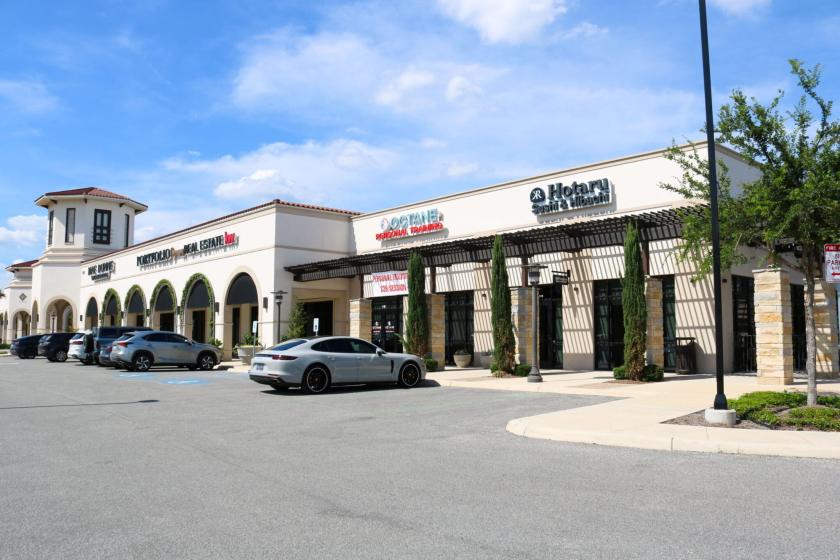
1-Mile | 3-Miles | 5-Miles | ||
---|---|---|---|---|
Total Population | 4,203 | 19,521 | 43,600 | |
Population Median Age | 40 | 37 | 36 | |
Population by Age | 0-9 Yrs | 649 (15%) | 2890 (14%) | 6232 (14%) |
10-19 Yrs | 564 (13%) | 3291 (16%) | 6629 (15%) | |
20-29 Yrs | 352 (8%) | 2019 (10%) | 5846 (13%) | |
30-39 Yrs | 413 (9%) | 2161 (11%) | 5815 (13%) | |
40-49 Yrs | 635 (15%) | 2859 (14%) | 6309 (14%) | |
50-59 Yrs | 600 (14%) | 2605 (13%) | 5265 (12%) | |
60-69 Yrs | 320 (7%) | 1582 (8%) | 3486 (7%) | |
70+ Yrs | 671 (15%) | 2115 (10%) | 4019 (9%) | |
Median HH Income | $102,936 | $120,517 | $109,346 | |
Total Household Income | < 24K | 377 (22%) | 719 (10%) | 1745 (11%) |
25-49K | 108 (6%) | 565 (8%) | 1612 (10%) | |
50-74K | 231 (14%) | 856 (12%) | 1935 (12%) | |
75-99K | 90 (5%) | 621 (9%) | 1716 (11%) | |
100-199K | 372 (22%) | 2055 (31%) | 4923 (32%) | |
200K+ | 462 (28%) | 1792 (27%) | 3346 (21%) | |
Highest Education Level | No Diploma | 174 | 414 | 839 |
Diploma or GED | 472 | 1500 | 3303 | |
Some College | 324 | 1964 | 5147 | |
Assoc. Degree | 260 | 1049 | 2143 | |
Bachelors Degree | 801 | 4008 | 9586 | |
Higher Degree | 775 | 3196 | 6351 | |
Total Housing Units | 1,818 | 7,384 | 16,906 | |
--Owner-Occupied | 1,259 | 5,013 | 10,193 | |
--Renter-Occupied | 380 | 1,596 | 5,085 | |
Owner-Occupied Values | < 100K | 49 | 106 | 196 |
100-199K | 79 | 173 | 320 | |
200-299K | 144 | 927 | 2165 | |
300-399K | 394 | 1291 | 2796 | |
400-499K | 217 | 1154 | 2349 | |
500K+ | 377 | 1362 | 2368 | |
Total Working Age Population | 3,210 | 14,984 | 33,793 | |
In Work Force | 2,068 | 9,570 | 22,825 | |
Not In Work Force | 1,142 | 5,414 | 10,969 | |
Workforce Employed | 2,018 | 9,288 | 22,018 | |
Workforce Unemployed | 48 | 251 | 736 | |
Civlian Workforce | 2,066 | 9,538 | 22,754 | |
Military Workforce | 2 | 32 | 71 | |
Total Households | 1,640 | 6,609 | 15,278 | |
Family Households | 1,003 | 4,666 | 10,122 | |
Non-Family Households | 637 | 1,943 | 5,156 | |
Married Couple | 836 | 3,675 | 8,132 | |
Other Family | 167 | 991 | 1,990 | |
Married w/Child | 376 | 1,823 | 3,777 | |
Single Male w/Child | 25 | 118 | 256 | |
Single Female w/Child | 80 | 414 | 915 |
Population Change Last Two Decades - Plus Projection
2000 | % | 2010 | % | 2020 | % | 2030 | |
---|---|---|---|---|---|---|---|
Texas | 20,851,820 | +21 | 25,145,561 | +18 | 29,677,668 | +18 | 34,894,452 |
Bexar County | 1,392,931 | +23 | 1,714,773 | +22 | 2,093,502 | +20 | 2,502,617 |
Total Working Age Population:
Total Households:
Total Working Age Population:
Total Households:
Total Working Age Population:
Total Households: