Office Space
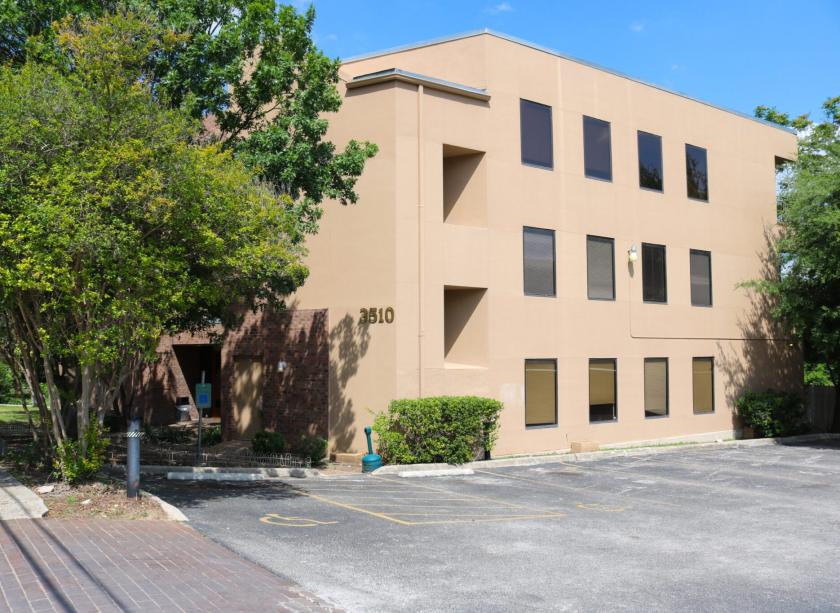
3510 North Saint Marys Street San Antonio, TX 78212
3510 North Saint Marys Street San Antonio, TX 78212
Details & Description
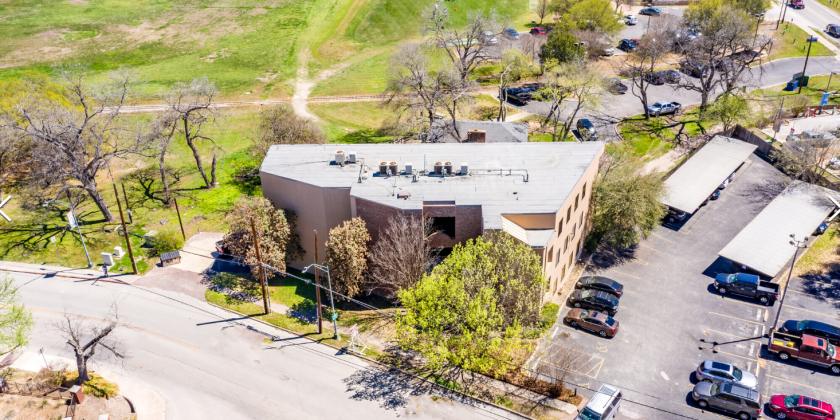
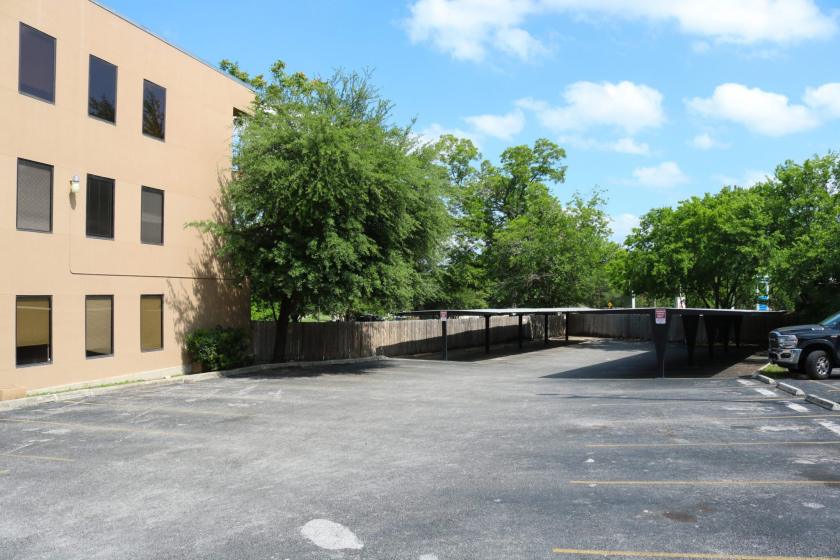
Additional Photos

Listing Agents

Gary Stephens
O: 210-233-6577
M: 210-445-2000
gary@valcorcre.com
O: 210-233-6577
M: 210-445-2000
gary@valcorcre.com
While we strive to provide the most accurate information, all listing information, and demographic data, is provided by third-parties. As such, MyEListing will not be responsible for the accuracy of the information. It is strongly recommended that you verify all information with the listing agent, and any relevant agencies, prior to making any decisions.


