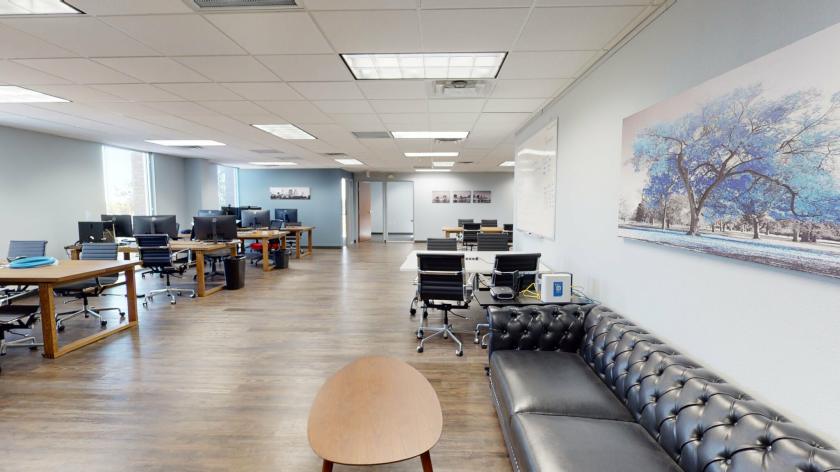
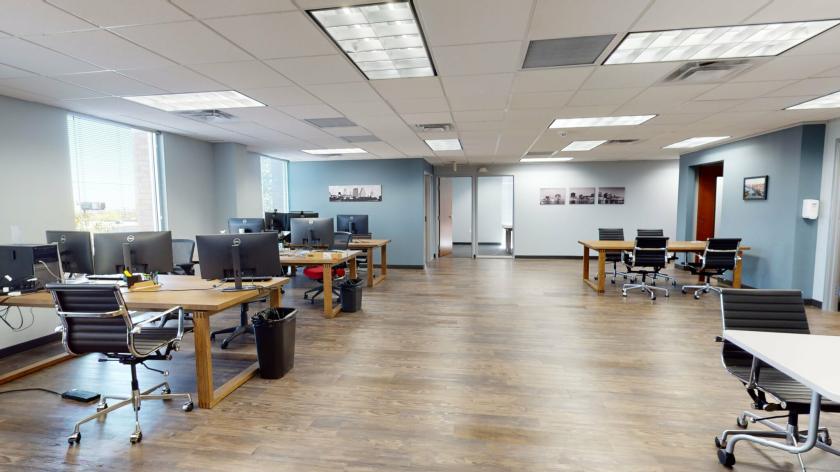
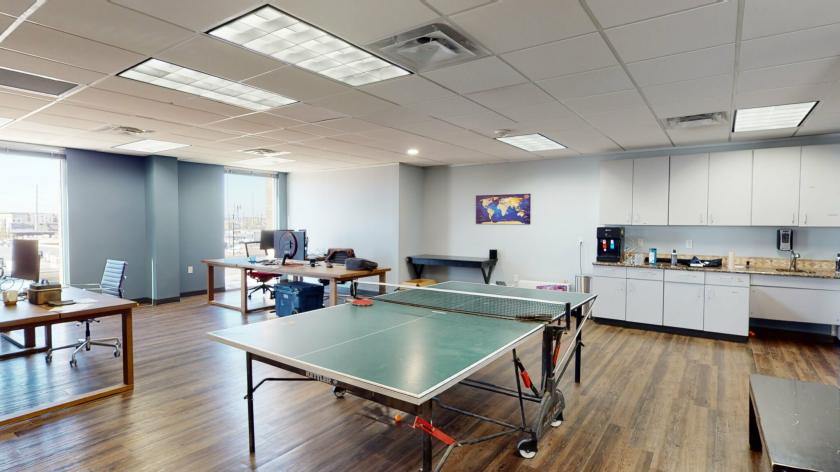
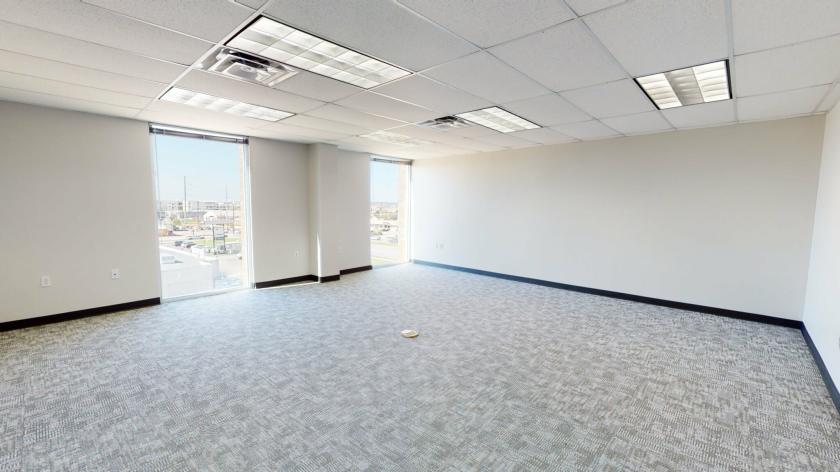
Office Space
7701-7703 N Lamar Blvd Austin, TX 78752
7701-7703 N Lamar Blvd Austin, TX 78752
Details & Description
Property Highlights
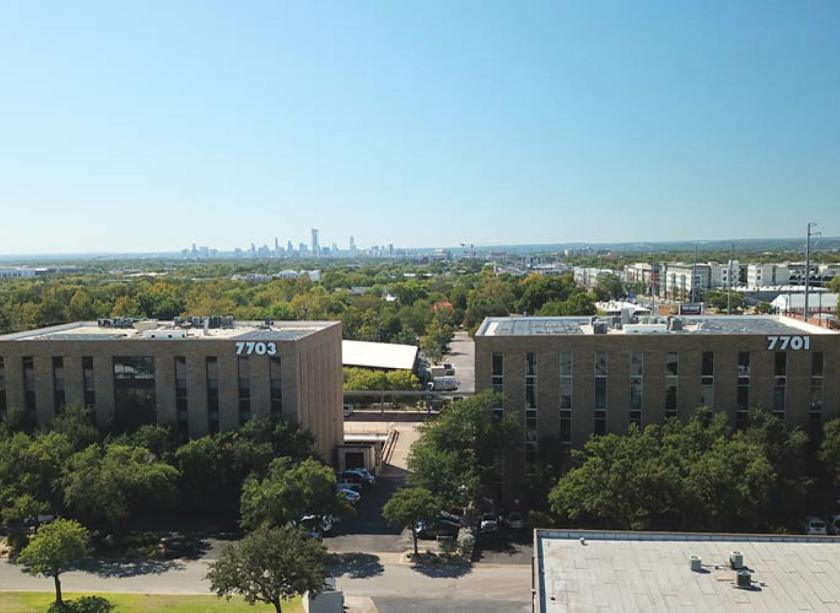
- • 7701 N Lamar 51,323 SF
- • 7703 N Lamar 50,093 SF
- • NBG-NP Zoning Allows for High-Density Mixed-Use
- • Ideally Located with easy access
- • Downtown Views
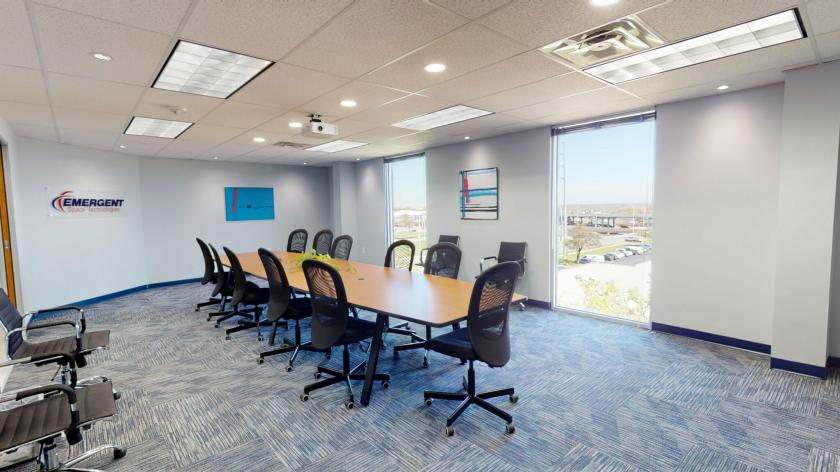
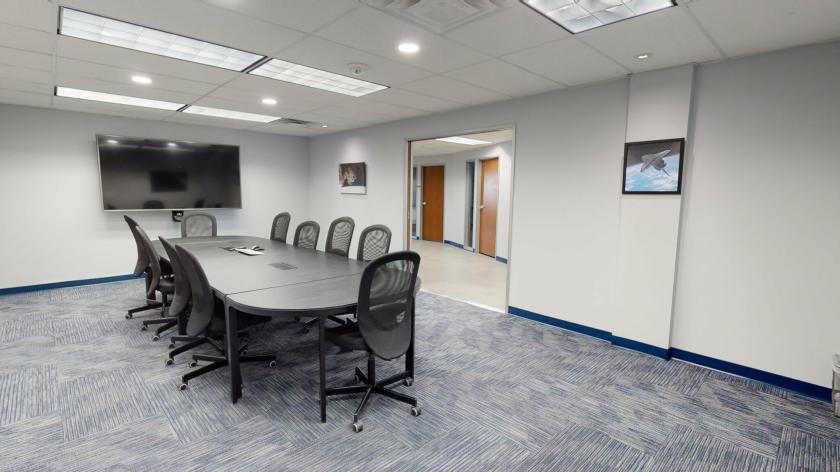
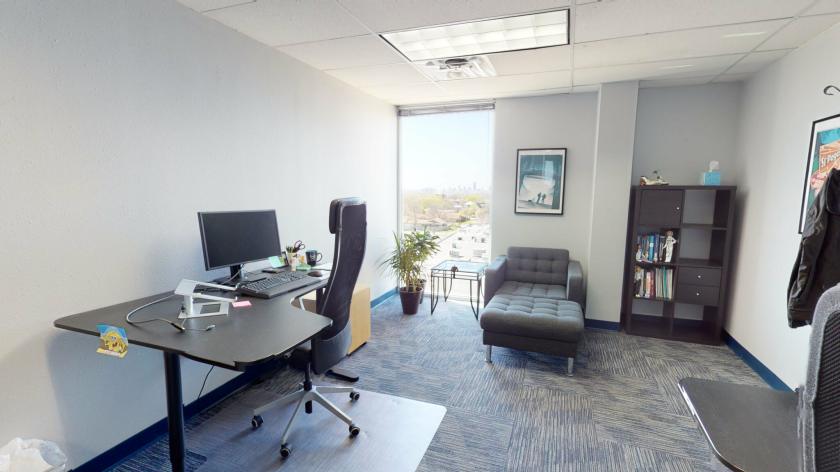
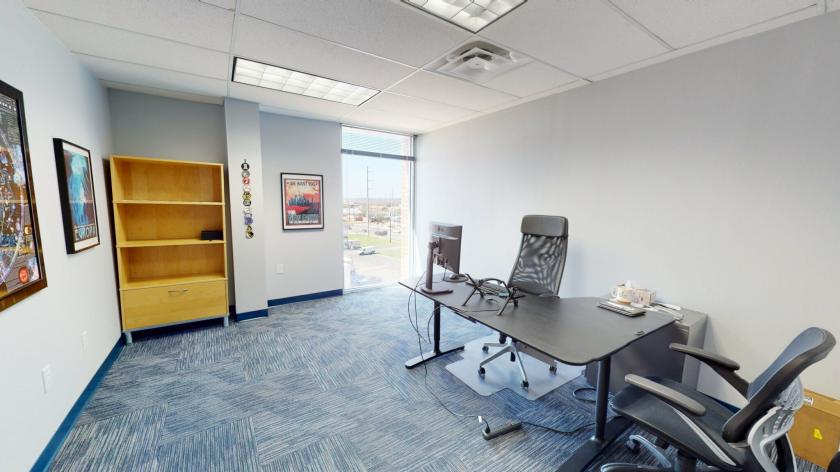
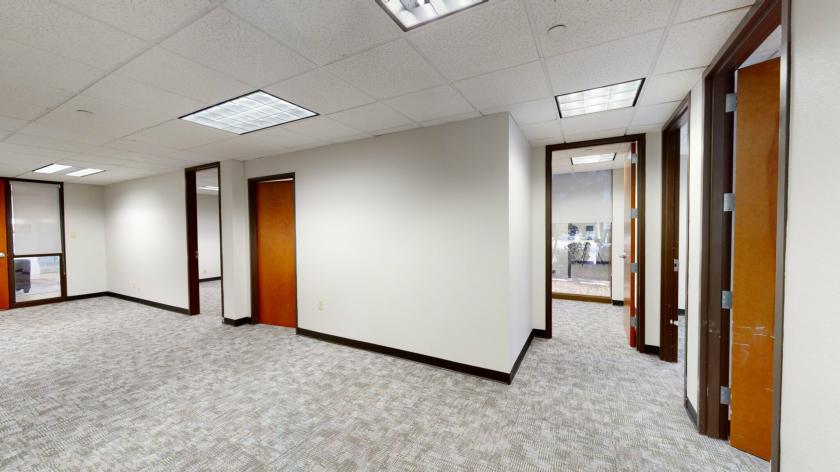
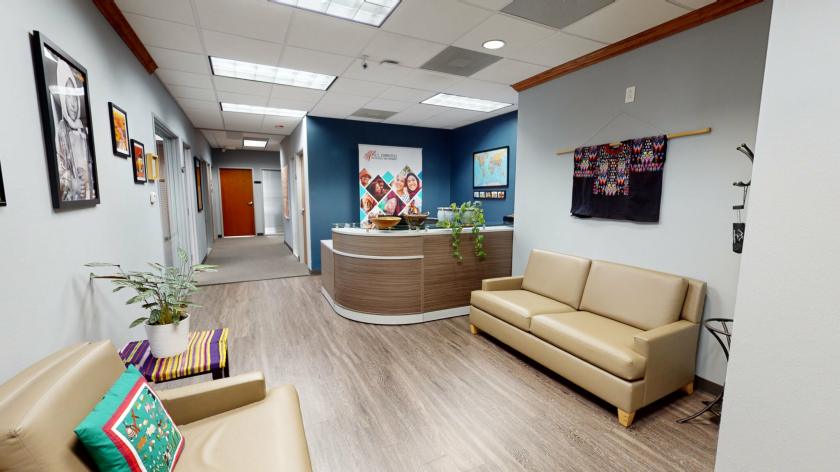
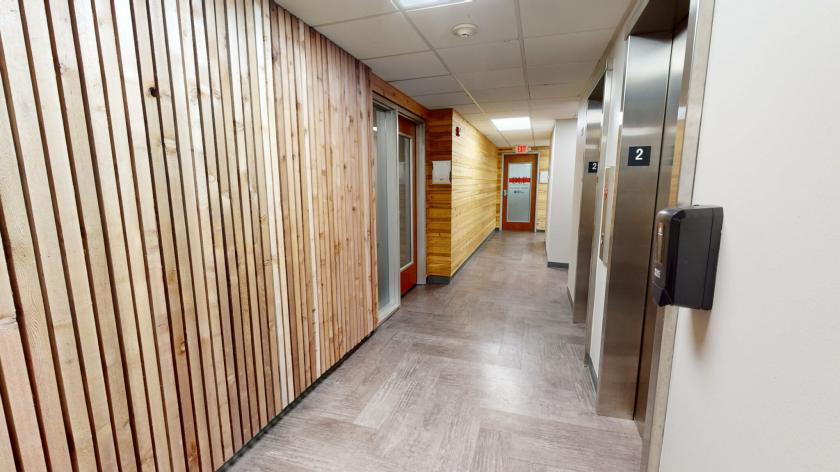
Additional Photos

Listing Agents

Lucian Morehead
O: 512-825-6287
lmorehead@asterra.com
O: 512-825-6287
lmorehead@asterra.com

Andrew Karr
O: 512-961-1883
akarr@asterra.com
O: 512-961-1883
akarr@asterra.com
While we strive to provide the most accurate information, all listing information, and demographic data, is provided by third-parties. As such, MyEListing will not be responsible for the accuracy of the information. It is strongly recommended that you verify all information with the listing agent, and any relevant agencies, prior to making any decisions.