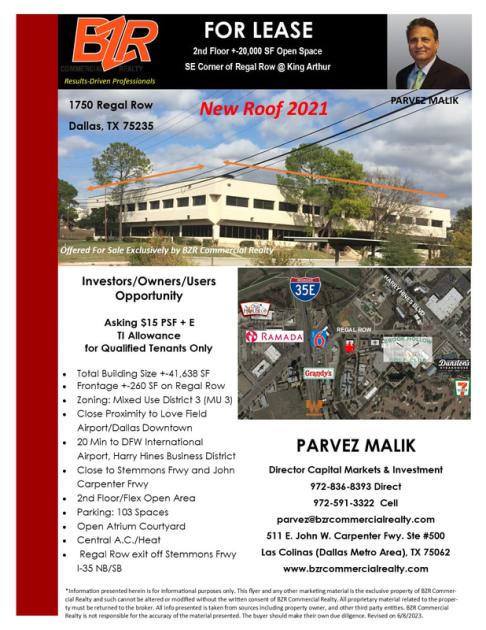
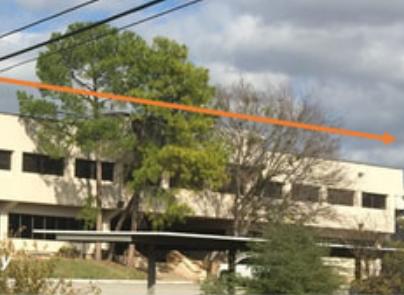
1-Mile | 3-Miles | 5-Miles | ||
---|---|---|---|---|
Total Population | 2,891 | 71,439 | 260,728 | |
Population Median Age | 40 | 34 | 36 | |
Population by Age | 0-9 Yrs | 350 (12%) | 9485 (13%) | 31166 (11%) |
10-19 Yrs | 333 (11%) | 8893 (12%) | 30909 (11%) | |
20-29 Yrs | 382 (13%) | 14562 (20%) | 49556 (19%) | |
30-39 Yrs | 340 (11%) | 11980 (16%) | 45177 (17%) | |
40-49 Yrs | 539 (18%) | 10152 (14%) | 35101 (13%) | |
50-59 Yrs | 217 (7%) | 7908 (11%) | 31195 (11%) | |
60-69 Yrs | 366 (12%) | 5115 (7%) | 21916 (8%) | |
70+ Yrs | 364 (12%) | 3345 (4%) | 15707 (6%) | |
Median HH Income | $37,688 | $48,667 | $70,793 | |
Total Household Income | < 24K | 390 (35%) | 5704 (20%) | 16102 (14%) |
25-49K | 259 (23%) | 8812 (31%) | 21545 (19%) | |
50-74K | 154 (14%) | 5360 (18%) | 20122 (18%) | |
75-99K | 147 (13%) | 3226 (11%) | 12290 (11%) | |
100-199K | 86 (7%) | 3646 (12%) | 23226 (21%) | |
200K+ | 53 (4%) | 1506 (5%) | 15924 (14%) | |
Highest Education Level | No Diploma | 976 | 16139 | 38524 |
Diploma or GED | 445 | 9818 | 27584 | |
Some College | 302 | 6094 | 22613 | |
Assoc. Degree | 48 | 1884 | 6862 | |
Bachelors Degree | 123 | 7991 | 49608 | |
Higher Degree | 92 | 4936 | 33460 | |
Total Housing Units | 1,118 | 31,072 | 121,297 | |
--Owner-Occupied | 430 | 7,992 | 43,052 | |
--Renter-Occupied | 658 | 20,262 | 66,159 | |
Owner-Occupied Values | < 100K | 38 | 1083 | 4256 |
100-199K | 157 | 2444 | 9346 | |
200-299K | 161 | 1744 | 6379 | |
300-399K | 0 | 708 | 4536 | |
400-499K | 74 | 554 | 3493 | |
500K+ | 0 | 1459 | 15041 | |
Total Working Age Population | 2,360 | 56,402 | 210,885 | |
In Work Force | 1,488 | 41,063 | 153,464 | |
Not In Work Force | 872 | 15,339 | 57,422 | |
Workforce Employed | 1,353 | 38,666 | 147,230 | |
Workforce Unemployed | 135 | 2,394 | 6,208 | |
Civlian Workforce | 1,488 | 41,060 | 153,437 | |
Military Workforce | 0 | 2 | 26 | |
Total Households | 1,088 | 28,254 | 109,210 | |
Family Households | 641 | 15,307 | 56,923 | |
Non-Family Households | 448 | 12,947 | 52,288 | |
Married Couple | 428 | 9,921 | 41,175 | |
Other Family | 213 | 5,386 | 15,748 | |
Married w/Child | 190 | 4,986 | 17,795 | |
Single Male w/Child | 22 | 683 | 1,993 | |
Single Female w/Child | 49 | 1,985 | 5,547 |
Population Change Last Two Decades - Plus Projection
2000 | % | 2010 | % | 2020 | % | 2030 | |
---|---|---|---|---|---|---|---|
Texas | 20,851,820 | +21 | 25,145,561 | +18 | 29,677,668 | +18 | 34,894,452 |
Dallas County | 2,218,899 | +7 | 2,368,139 | +15 | 2,734,111 | +14 | 3,106,298 |
Total Working Age Population:
Total Households:
Total Working Age Population:
Total Households:
Total Working Age Population:
Total Households: