Commercial Land
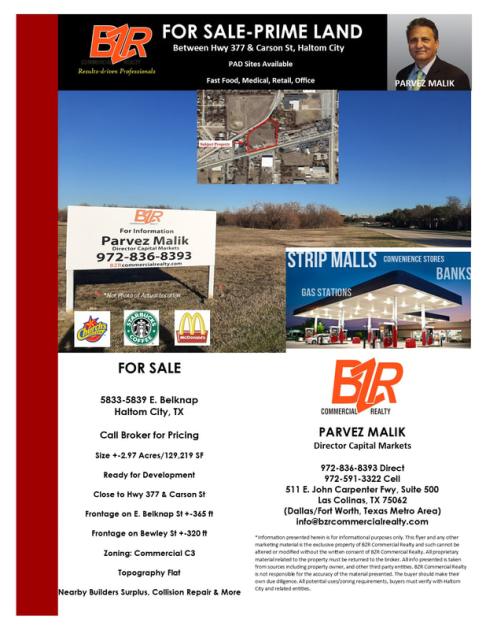
5833-5839 E Belknap St Haltom City, TX 76117
5833-5839 E Belknap St Haltom City, TX 76117
Details & Description
Property Highlights
- • Ready for Development
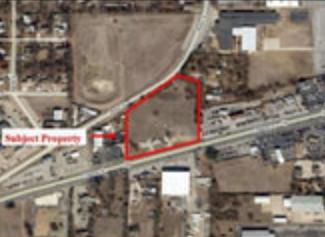
- • Close to 377 & Carson St.
- • Frontage on E. Belknap St. +/- 365 ft.
- • Frontage on Bewley St. +/- 320 ft.
- • Topography: flat
- • Pad sites available
Listing Agents

Malik Parvez
O: 972-836-8393
M: 972-591-3322
parvez@bzrcommercialrealty.com
O: 972-836-8393
M: 972-591-3322
parvez@bzrcommercialrealty.com
While we strive to provide the most accurate information, all listing information, and demographic data, is provided by third-parties. As such, MyEListing will not be responsible for the accuracy of the information. It is strongly recommended that you verify all information with the listing agent, and any relevant agencies, prior to making any decisions.