Retail Space
511 Richmond Avenue Houston, TX 77006
511 Richmond Avenue Houston, TX 77006
Details & Description
Property Highlights
- • Ideal for Coffee, Dessert or Food to Go Users
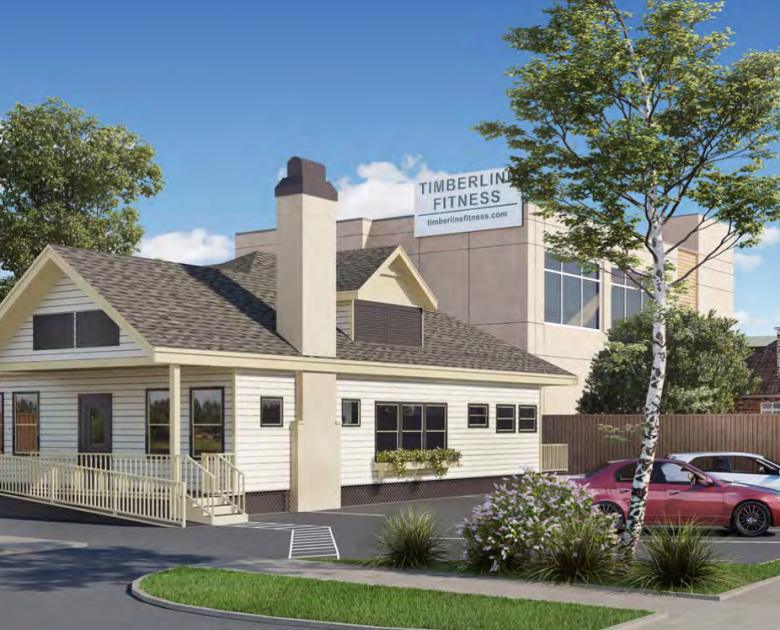
- • 2 Pylon Signs
- • Excellent Exposure to Richmond Ave
- • Off-site parking available
Listing Agents

Ryan Neyland
O: 281-995-2200
M: 713-398-9560
ryan@palodurocp.com
O: 281-995-2200
M: 713-398-9560
ryan@palodurocp.com
While we strive to provide the most accurate information, all listing information, and demographic data, is provided by third-parties. As such, MyEListing will not be responsible for the accuracy of the information. It is strongly recommended that you verify all information with the listing agent, and any relevant agencies, prior to making any decisions.