Retail Space
4602 Irvington Boulevard Houston, TX 77009
4602 Irvington Boulevard Houston, TX 77009
Details & Description
Property Highlights
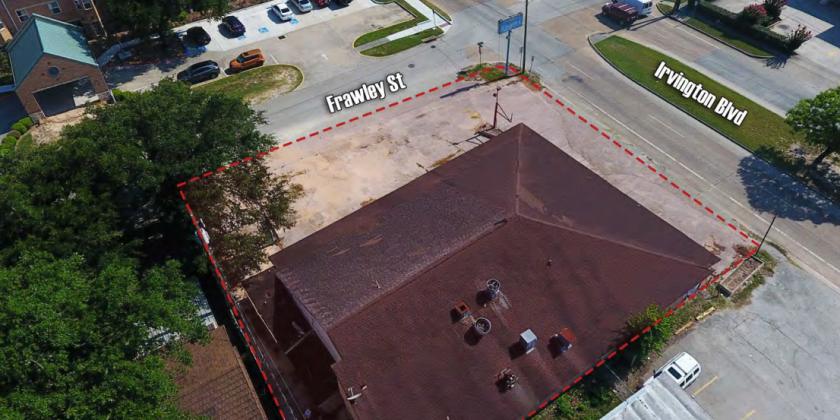
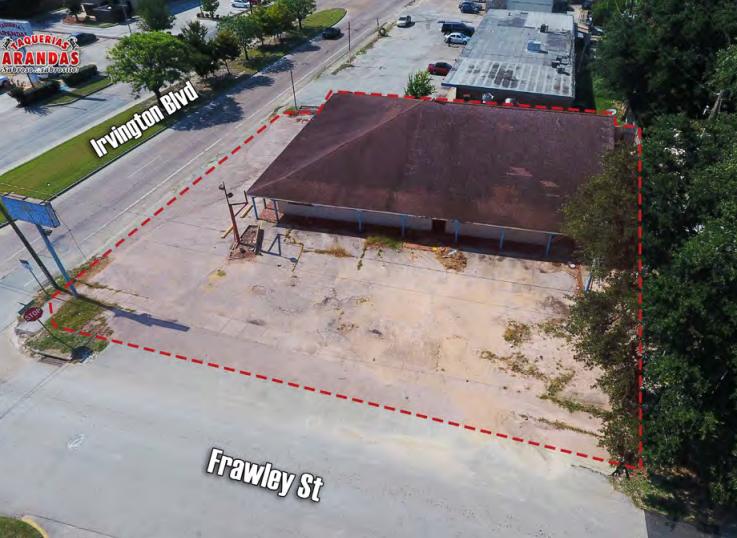
- • NEC of Irvington Blvd and Frawley St
- • Former Restaurant
- • Pylon Sign
- • Close Proximity to I-45 and 610 Loop
Listing Agents

Ryan Neyland
O: 281-995-2200
M: 713-398-9560
ryan@palodurocp.com
O: 281-995-2200
M: 713-398-9560
ryan@palodurocp.com
While we strive to provide the most accurate information, all listing information, and demographic data, is provided by third-parties. As such, MyEListing will not be responsible for the accuracy of the information. It is strongly recommended that you verify all information with the listing agent, and any relevant agencies, prior to making any decisions.