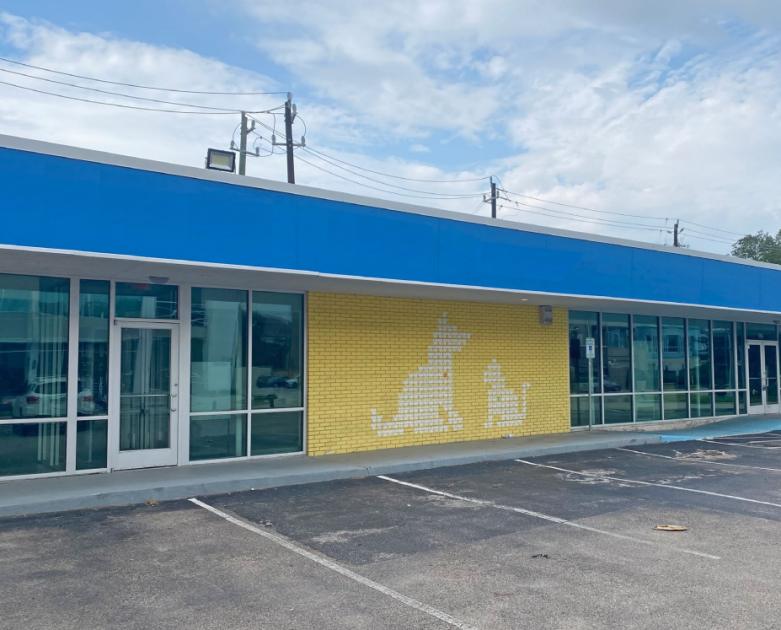
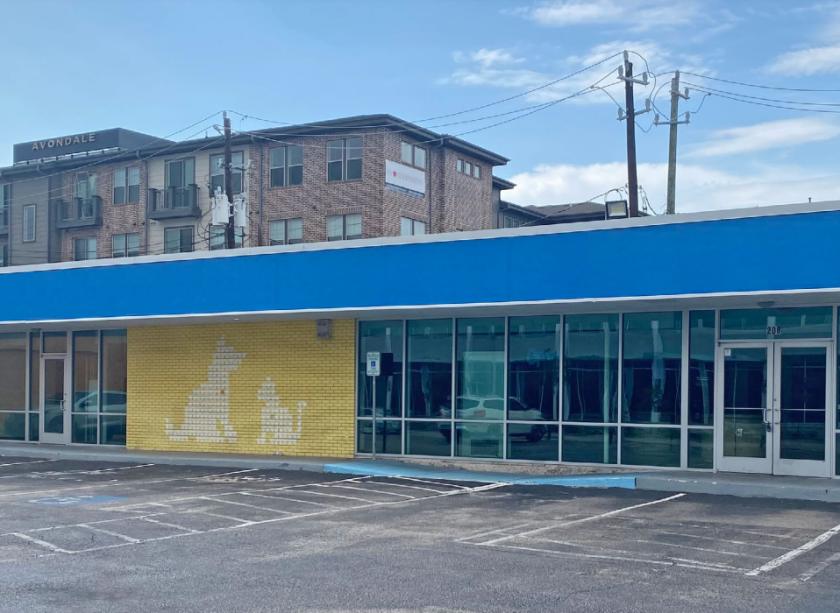
1-Mile | 3-Miles | 5-Miles | ||
---|---|---|---|---|
Total Population | 29,729 | 183,986 | 435,325 | |
Population Median Age | 36 | 37 | 37 | |
Population by Age | 0-9 Yrs | 1657 (5%) | 13889 (7%) | 43249 (9%) |
10-19 Yrs | 911 (3%) | 13474 (7%) | 37145 (8%) | |
20-29 Yrs | 9968 (33%) | 47594 (25%) | 94420 (21%) | |
30-39 Yrs | 7136 (24%) | 40065 (21%) | 85614 (19%) | |
40-49 Yrs | 3339 (11%) | 21326 (11%) | 53149 (12%) | |
50-59 Yrs | 3127 (10%) | 19593 (10%) | 48044 (11%) | |
60-69 Yrs | 2109 (7%) | 16402 (8%) | 41156 (9%) | |
70+ Yrs | 1481 (4%) | 11643 (6%) | 32548 (7%) | |
Median HH Income | $82,563 | $90,115 | $77,696 | |
Total Household Income | < 24K | 2696 (15%) | 13381 (15%) | 35858 (18%) |
25-49K | 2343 (13%) | 10978 (12%) | 31326 (15%) | |
50-74K | 3088 (17%) | 13140 (15%) | 29229 (14%) | |
75-99K | 2199 (12%) | 10082 (11%) | 20737 (10%) | |
100-199K | 4473 (25%) | 21649 (24%) | 43169 (21%) | |
200K+ | 2786 (15%) | 17960 (20%) | 36982 (18%) | |
Highest Education Level | No Diploma | 378 | 8241 | 33629 |
Diploma or GED | 1814 | 14561 | 42149 | |
Some College | 2933 | 17012 | 40518 | |
Assoc. Degree | 994 | 5893 | 13900 | |
Bachelors Degree | 9323 | 47415 | 96824 | |
Higher Degree | 8002 | 43469 | 90105 | |
Total Housing Units | 20,159 | 100,719 | 226,299 | |
--Owner-Occupied | 5,784 | 34,474 | 84,966 | |
--Renter-Occupied | 11,801 | 52,715 | 112,336 | |
Owner-Occupied Values | < 100K | 214 | 1156 | 9027 |
100-199K | 450 | 3097 | 11476 | |
200-299K | 875 | 4707 | 9739 | |
300-399K | 1264 | 7086 | 12990 | |
400-499K | 923 | 4434 | 9703 | |
500K+ | 2058 | 13994 | 32031 | |
Total Working Age Population | 27,642 | 164,197 | 371,477 | |
In Work Force | 22,224 | 113,134 | 252,823 | |
Not In Work Force | 5,418 | 51,063 | 118,654 | |
Workforce Employed | 21,406 | 107,795 | 240,193 | |
Workforce Unemployed | 818 | 5,183 | 12,422 | |
Civlian Workforce | 22,224 | 112,977 | 252,615 | |
Military Workforce | 0 | 157 | 208 | |
Total Households | 17,585 | 87,189 | 197,301 | |
Family Households | 4,701 | 33,227 | 90,580 | |
Non-Family Households | 12,883 | 53,962 | 106,721 | |
Married Couple | 3,764 | 26,058 | 67,113 | |
Other Family | 938 | 7,169 | 23,467 | |
Married w/Child | 766 | 7,557 | 23,644 | |
Single Male w/Child | 133 | 783 | 2,518 | |
Single Female w/Child | 326 | 2,111 | 7,728 |
Population Change Last Two Decades - Plus Projection
2000 | % | 2010 | % | 2020 | % | 2030 | |
---|---|---|---|---|---|---|---|
Texas | 20,851,820 | +21 | 25,145,561 | +18 | 29,677,668 | +18 | 34,894,452 |
Harris County | 3,400,578 | +20 | 4,092,459 | +22 | 4,978,845 | +19 | 5,924,750 |
Total Working Age Population:
Total Households:
Total Working Age Population:
Total Households:
Total Working Age Population:
Total Households: