Retail Space
8975 Kingsridge Drive Dayton, OH 45458
8975 Kingsridge Drive Dayton, OH 45458
Details & Description
Property Highlights
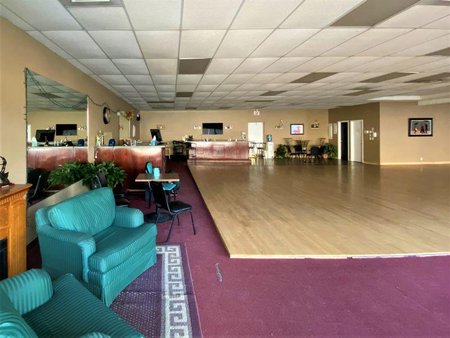
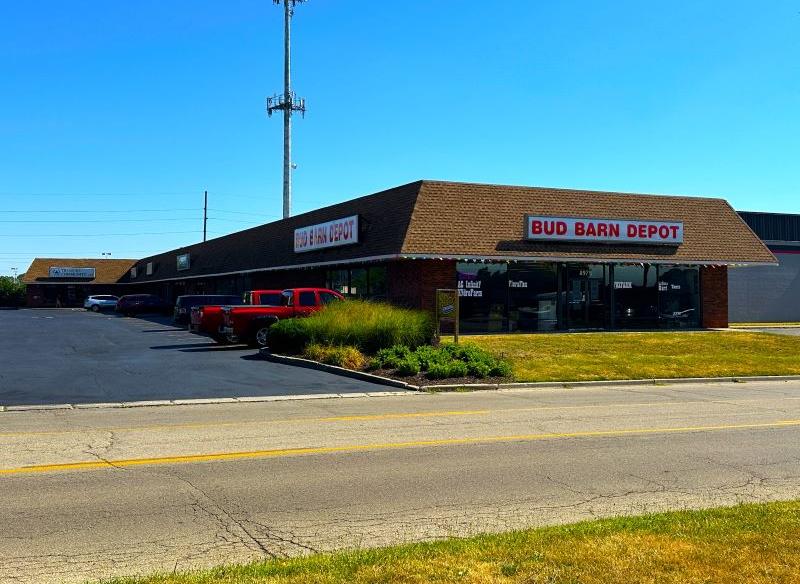
- • Corner space faces Kingsridge Drive.
- • Front and side window offer light-filled space.
- • Convenient parking in front of the building.
- • Easy access, close to many amenities.
- • Just minutes from the busy Dayton Mall area.
Additional Photos


Listing Agents

Timothy Albro
O: 937-222-1600
M: 937-609-8071
talbro@crestrealtyohio.com
O: 937-222-1600
M: 937-609-8071
talbro@crestrealtyohio.com
While we strive to provide the most accurate information, all listing information, and demographic data, is provided by third-parties. As such, MyEListing will not be responsible for the accuracy of the information. It is strongly recommended that you verify all information with the listing agent, and any relevant agencies, prior to making any decisions.