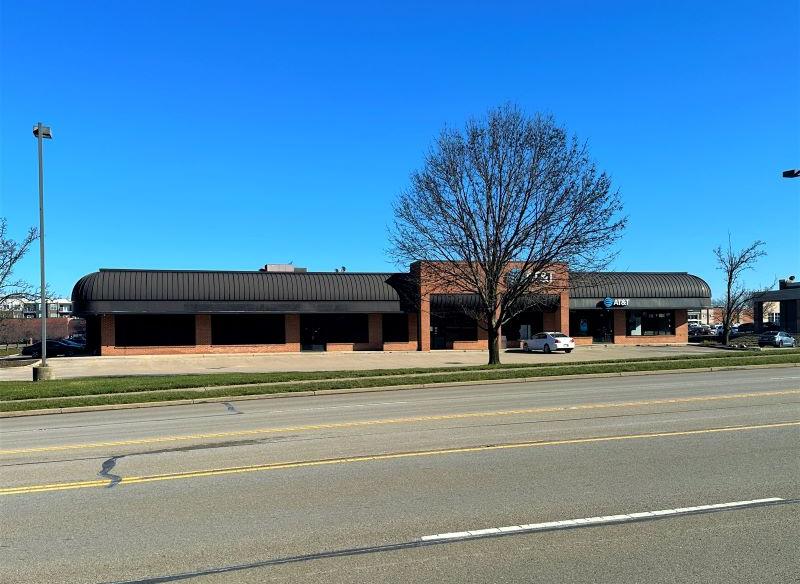
Retail Space
199 East Alex Bell Road Centerville, OH 45459
199 East Alex Bell Road Centerville, OH 45459
Details & Description
Property Highlights
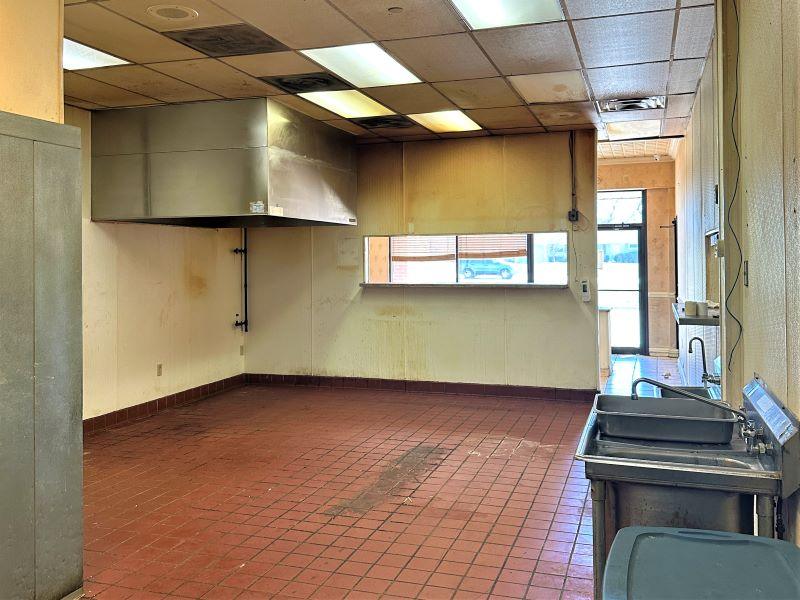
- • Full kitchen, bar and restaurant seating area.
- • Additional square footage available.
- • Construction allowance negotiable.
Additional Photos


Listing Agents

Timothy Albro
O: 937-222-1600
M: 937-609-8071
talbro@crestrealtyohio.com
O: 937-222-1600
M: 937-609-8071
talbro@crestrealtyohio.com
While we strive to provide the most accurate information, all listing information, and demographic data, is provided by third-parties. As such, MyEListing will not be responsible for the accuracy of the information. It is strongly recommended that you verify all information with the listing agent, and any relevant agencies, prior to making any decisions.