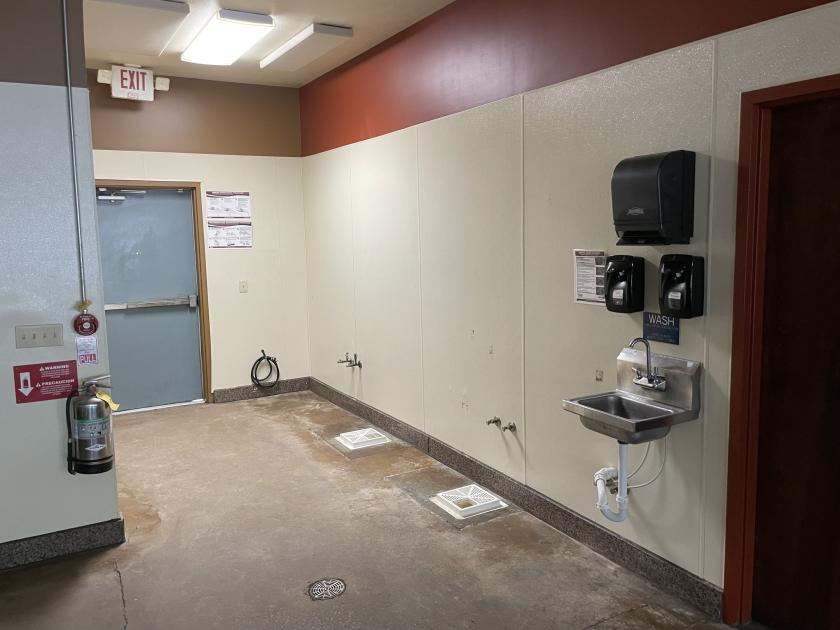
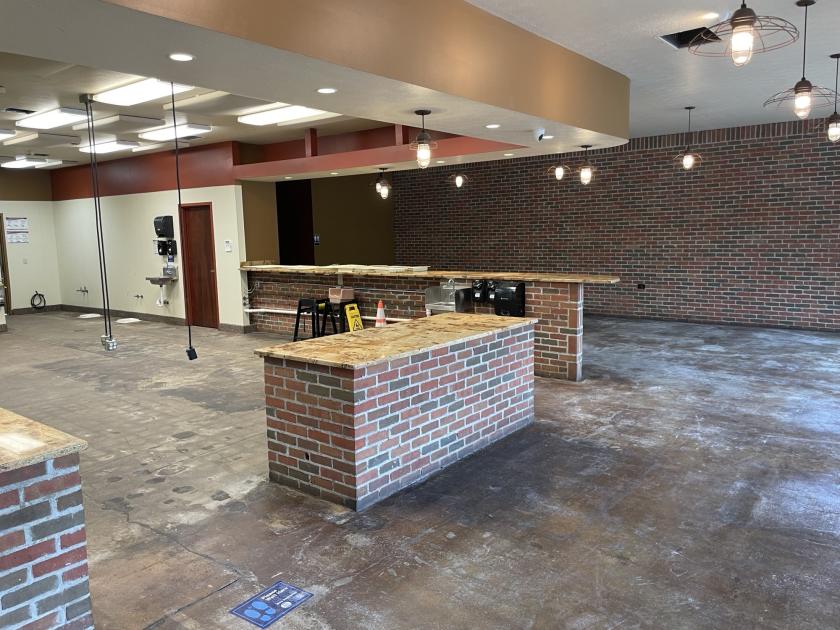
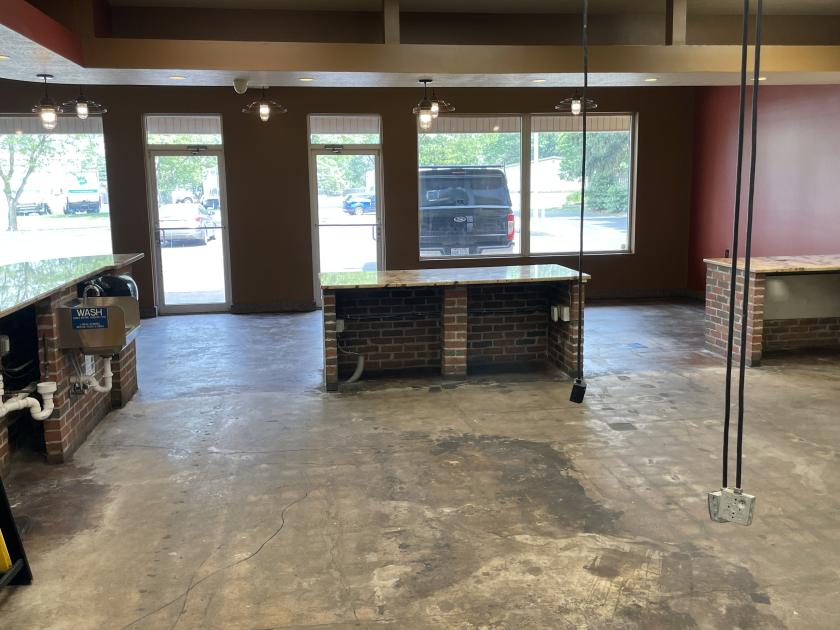
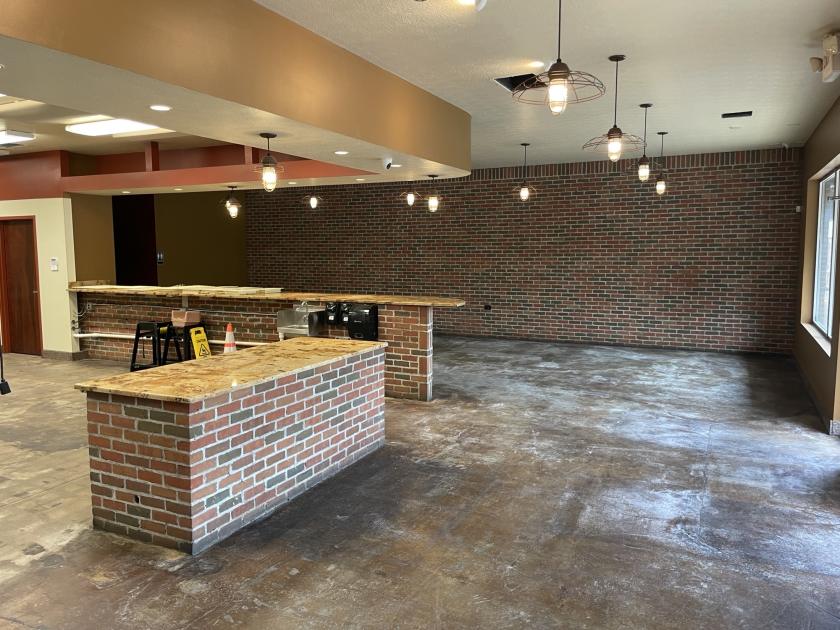
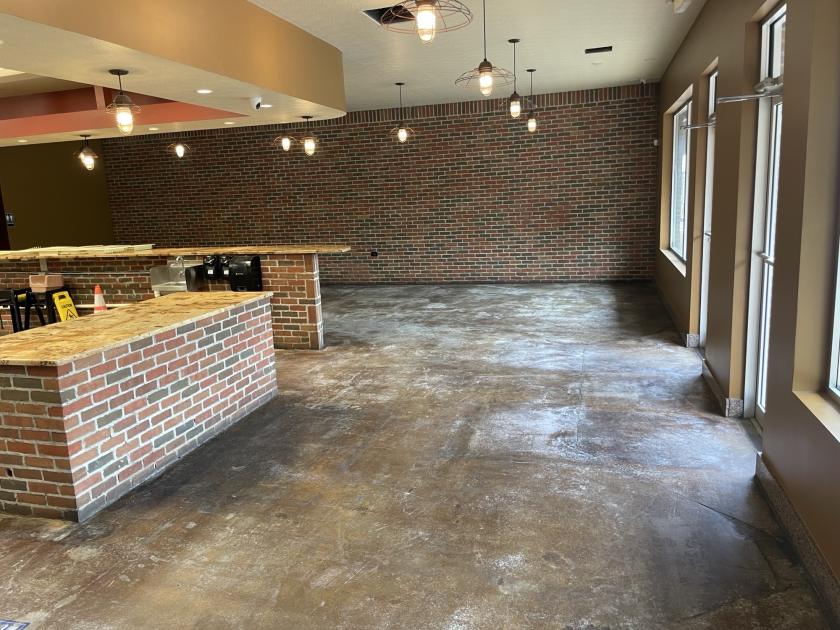
Retail Space
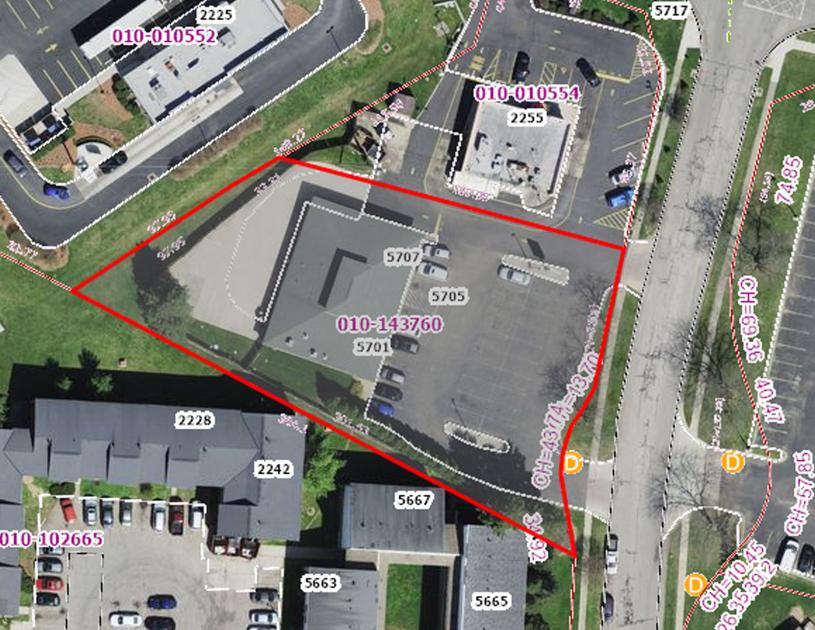
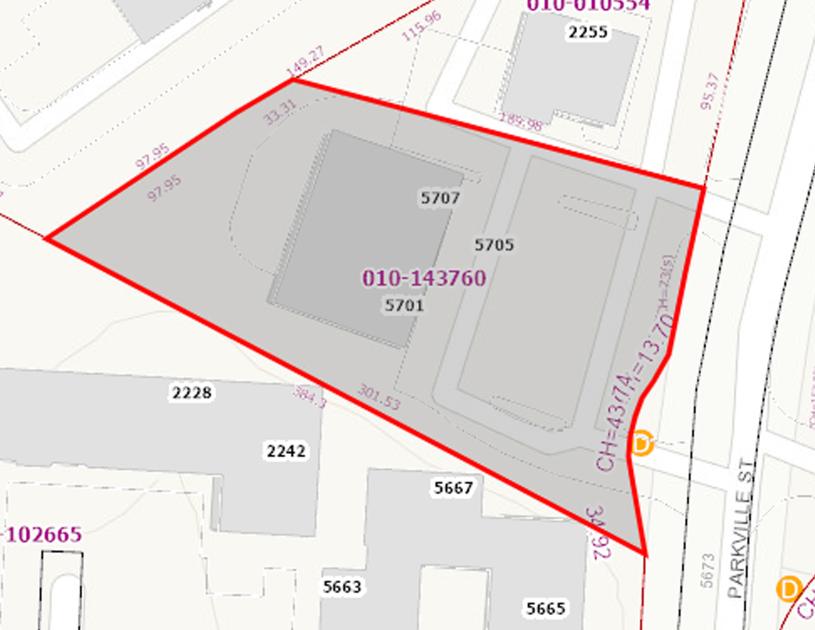
5701 Parkville Street Columbus, OH 43229
5701 Parkville Street Columbus, OH 43229

Details & Description
Property Highlights
- • User ready
- • Great visibility
- • Plenty of parking space
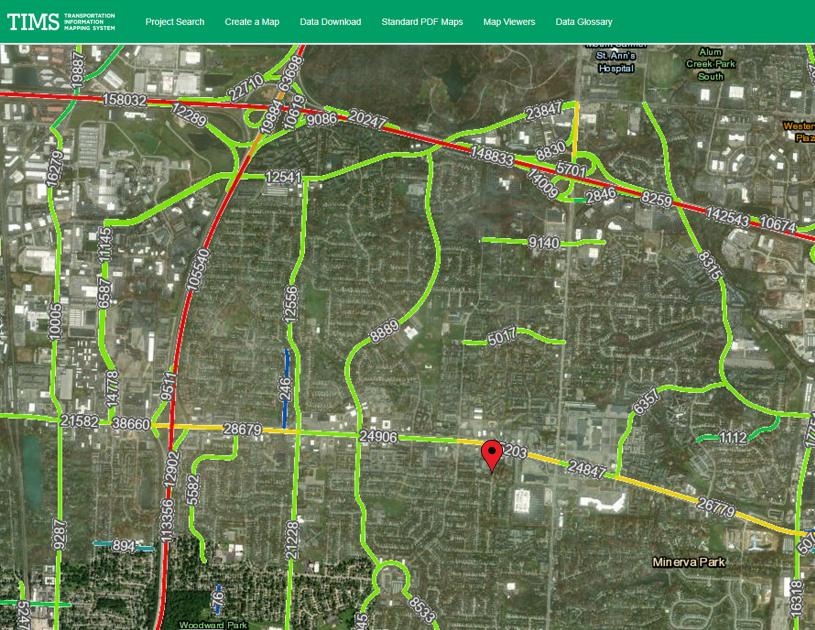
- • Minutes from I-71
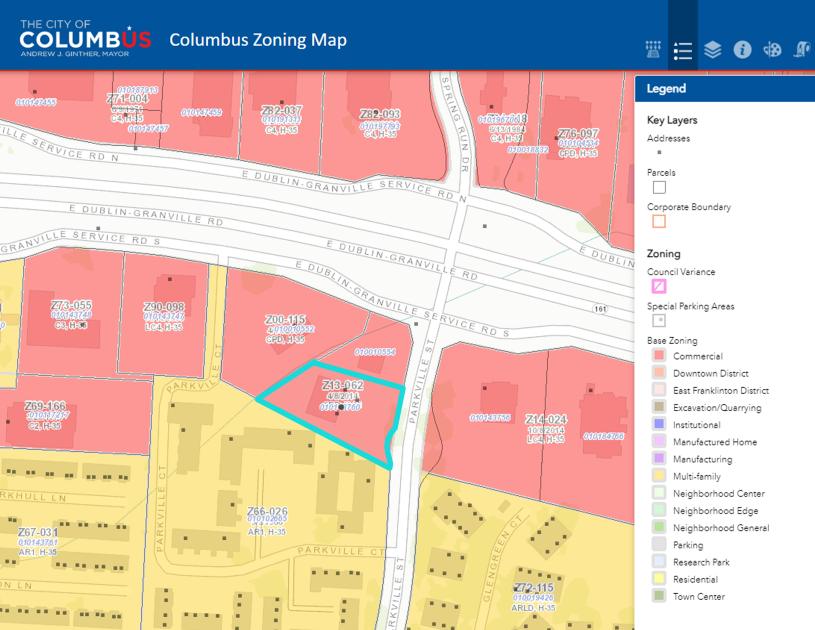
- • Zoned Planned Commercial Development District
Additional Photos


Listing Agents

Ty Patillo
M: 440-339-6001
tpatillo@rweiler.com
M: 440-339-6001
tpatillo@rweiler.com
While we strive to provide the most accurate information, all listing information, and demographic data, is provided by third-parties. As such, MyEListing will not be responsible for the accuracy of the information. It is strongly recommended that you verify all information with the listing agent, and any relevant agencies, prior to making any decisions.