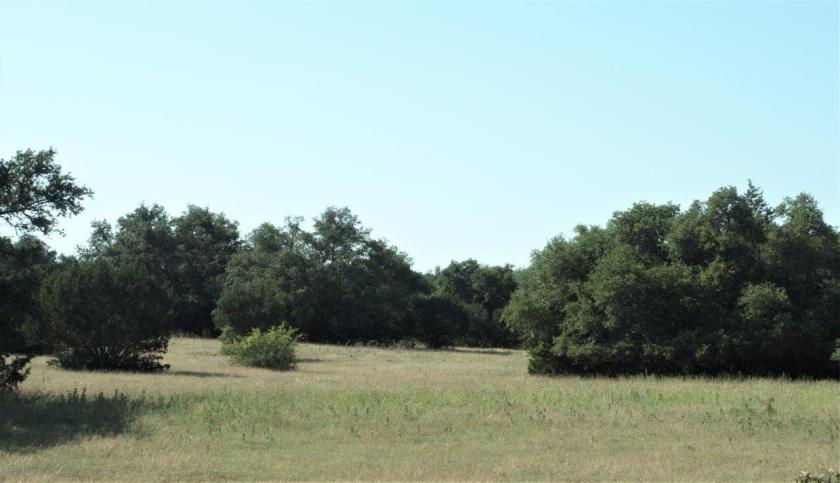
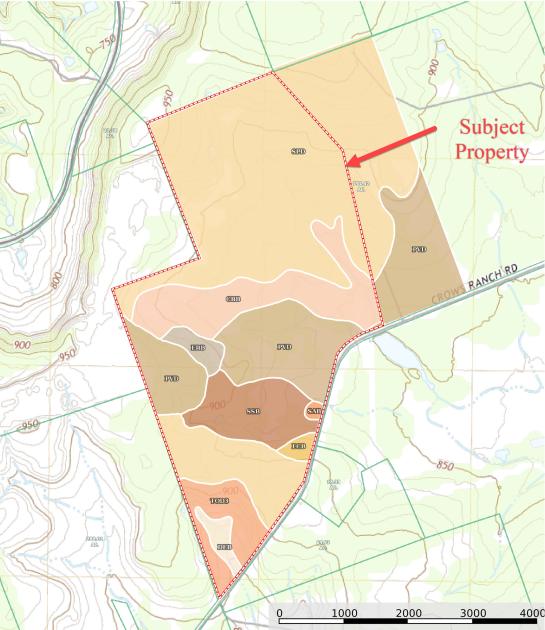
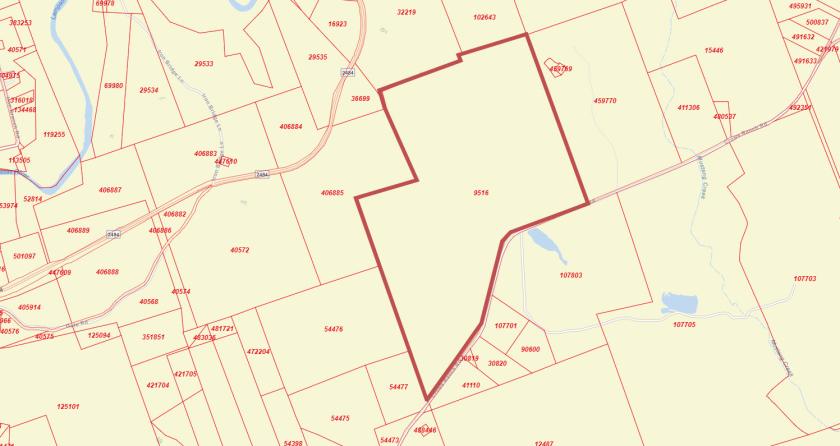
Commercial Land
16380 Crows Ranch Road Salado, TX 76571
16380 Crows Ranch Road Salado, TX 76571

Details & Description
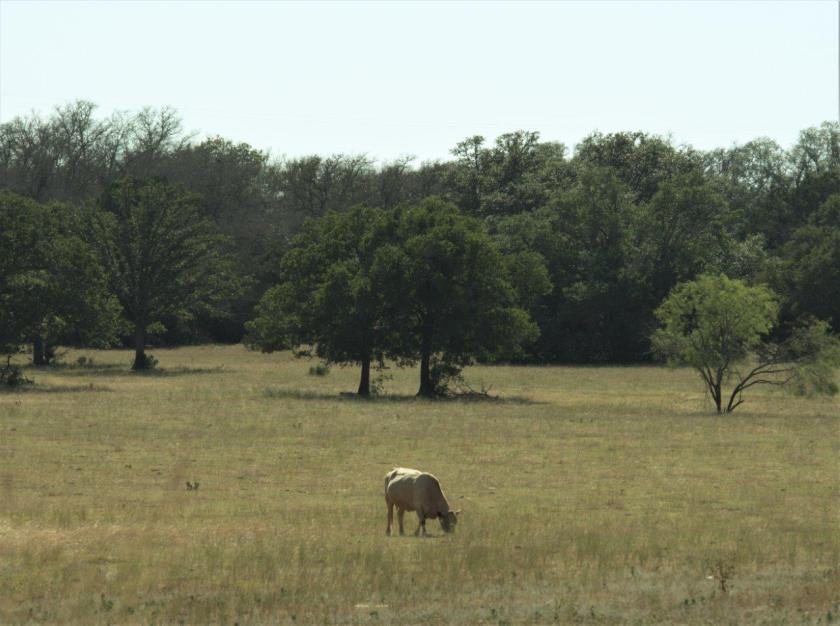
Additional Photos

Listing Agents

Lloyd Thomas
O: 254-773-4901
M: 254-770-8287
althomas@aldrich-thomas.com
O: 254-773-4901
M: 254-770-8287
althomas@aldrich-thomas.com
While we strive to provide the most accurate information, all listing information, and demographic data, is provided by third-parties. As such, MyEListing will not be responsible for the accuracy of the information. It is strongly recommended that you verify all information with the listing agent, and any relevant agencies, prior to making any decisions.