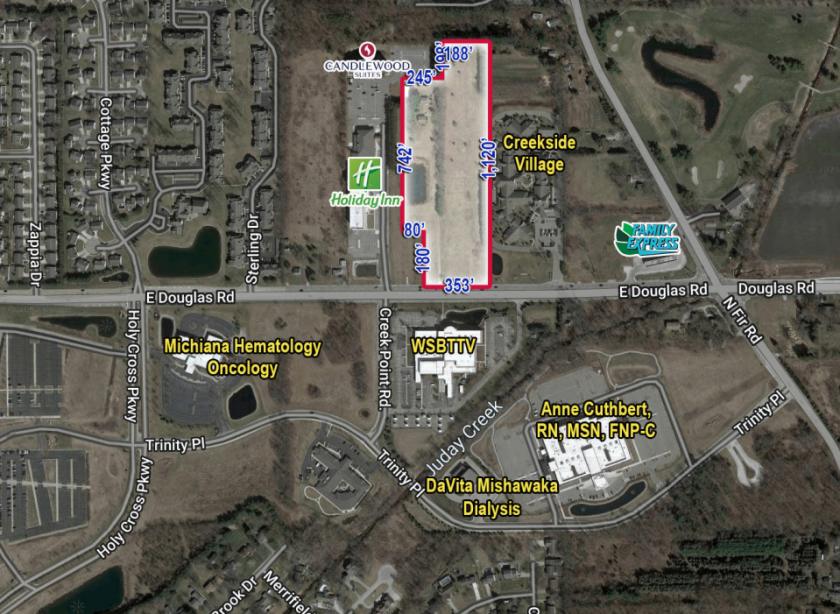
1-Mile | 3-Miles | 5-Miles | ||
---|---|---|---|---|
Total Population | 6,053 | 56,075 | 147,770 | |
Population Median Age | 38 | 38 | 37 | |
Population by Age | 0-9 Yrs | 577 (9%) | 5883 (10%) | 17475 (11%) |
10-19 Yrs | 556 (9%) | 7740 (13%) | 21999 (14%) | |
20-29 Yrs | 1498 (24%) | 10493 (18%) | 25611 (17%) | |
30-39 Yrs | 1068 (17%) | 6948 (12%) | 18190 (12%) | |
40-49 Yrs | 541 (8%) | 5981 (10%) | 16351 (11%) | |
50-59 Yrs | 624 (10%) | 5805 (10%) | 16220 (10%) | |
60-69 Yrs | 561 (9%) | 6984 (12%) | 17752 (12%) | |
70+ Yrs | 629 (10%) | 6241 (11%) | 14173 (9%) | |
Median HH Income | $42,205 | $52,405 | $54,271 | |
Total Household Income | < 24K | 794 (24%) | 5199 (22%) | 12635 (22%) |
25-49K | 1089 (34%) | 6089 (26%) | 14027 (24%) | |
50-74K | 555 (17%) | 4147 (17%) | 10917 (19%) | |
75-99K | 265 (8%) | 2828 (12%) | 6891 (12%) | |
100-199K | 355 (11%) | 3916 (16%) | 9937 (17%) | |
200K+ | 138 (4%) | 1222 (5%) | 2989 (5%) | |
Highest Education Level | No Diploma | 160 | 2919 | 8564 |
Diploma or GED | 1078 | 8717 | 24710 | |
Some College | 770 | 6871 | 19223 | |
Assoc. Degree | 378 | 2643 | 7744 | |
Bachelors Degree | 1034 | 8622 | 18576 | |
Higher Degree | 889 | 6768 | 15001 | |
Total Housing Units | 3,728 | 26,754 | 65,278 | |
--Owner-Occupied | 800 | 12,988 | 36,232 | |
--Renter-Occupied | 2,397 | 10,413 | 21,164 | |
Owner-Occupied Values | < 100K | 127 | 3285 | 12156 |
100-199K | 365 | 5404 | 13815 | |
200-299K | 203 | 2404 | 5811 | |
300-399K | 85 | 987 | 2123 | |
400-499K | 4 | 290 | 705 | |
500K+ | 16 | 617 | 1622 | |
Total Working Age Population | 5,086 | 46,429 | 119,207 | |
In Work Force | 3,700 | 29,059 | 75,704 | |
Not In Work Force | 1,387 | 17,370 | 43,503 | |
Workforce Employed | 3,490 | 27,533 | 71,699 | |
Workforce Unemployed | 206 | 1,455 | 3,856 | |
Civlian Workforce | 3,696 | 28,988 | 75,556 | |
Military Workforce | 3 | 71 | 148 | |
Total Households | 3,196 | 23,400 | 57,396 | |
Family Households | 1,102 | 12,420 | 32,981 | |
Non-Family Households | 2,095 | 10,981 | 24,415 | |
Married Couple | 844 | 9,350 | 23,887 | |
Other Family | 257 | 3,070 | 9,094 | |
Married w/Child | 328 | 3,353 | 9,244 | |
Single Male w/Child | 84 | 471 | 1,233 | |
Single Female w/Child | 56 | 1,203 | 4,022 |
Population Change Last Two Decades - Plus Projection
2000 | % | 2010 | % | 2020 | % | 2030 | |
---|---|---|---|---|---|---|---|
Indiana | 6,080,485 | +7 | 6,483,802 | +4 | 6,738,573 | +4 | 7,014,880 |
St. Joseph County | 265,559 | +1 | 266,931 | +1 | 269,113 | +1 | 271,912 |
Michigan | 9,938,444 | -1 | 9,883,640 | +1 | 10,023,423 | +4 | 10,424,510 |
Berrien County | 162,453 | -3 | 156,813 | -2 | 153,154 | +2 | 156,590 |
Cass County | 51,104 | +2 | 52,293 | -2 | 51,383 | +3 | 53,143 |
Total Working Age Population:
Total Households:
Total Working Age Population:
Total Households:
Total Working Age Population:
Total Households: