Multifamily Housing
2299 Seminole Avenue Springfield, OH 45506
2299 Seminole Avenue Springfield, OH 45506

Details & Description
Property Highlights
- • Motivated Seller
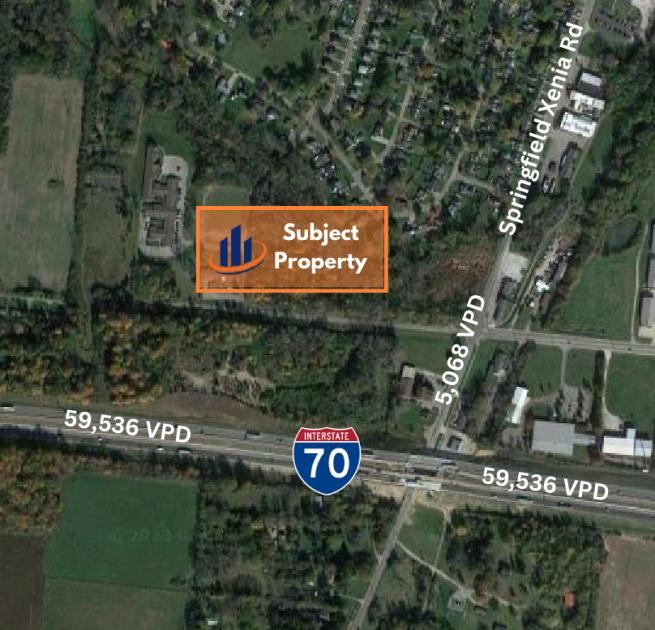
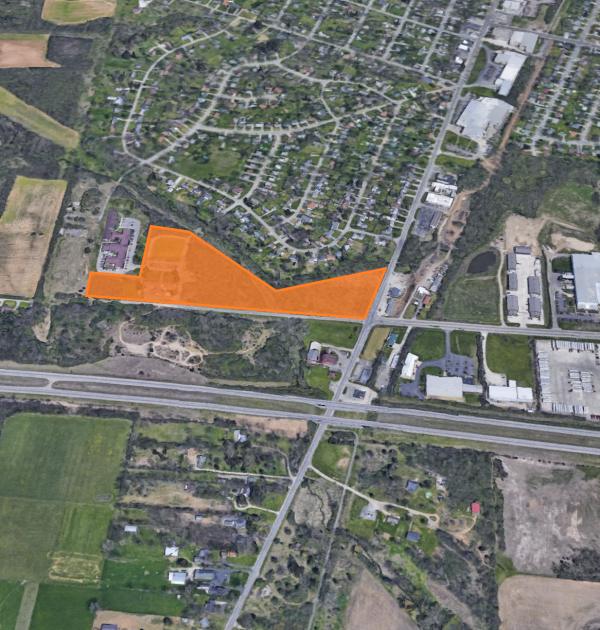
- • Easy Freeway Access to I-70
- • Abundance of Food and Retail Establishments Nearby
- • Downtown Dayton is a +/-30-Minute Drive
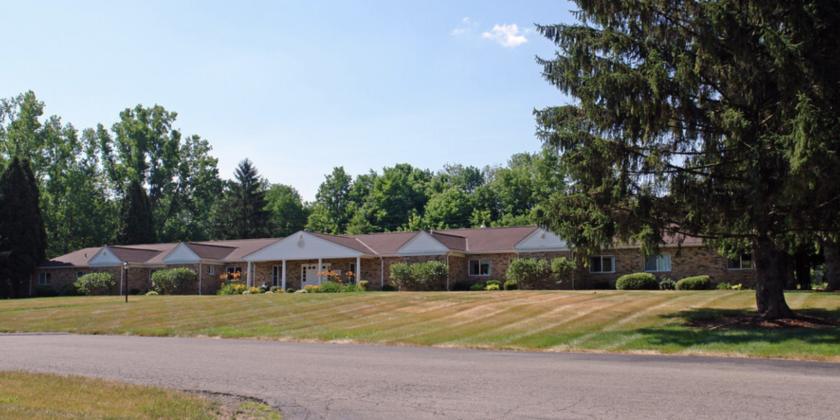
Additional Photos
Listing Agents

Jerry Fiume
O: 234-231-0235
M: 330-416-0501
jerry.fiume@svn.com
O: 234-231-0235
M: 330-416-0501
jerry.fiume@svn.com

Brad Weidman
O: 234-231-6251
M: 330-466-8550
brad.weidman@svn.com
O: 234-231-6251
M: 330-466-8550
brad.weidman@svn.com
While we strive to provide the most accurate information, all listing information, and demographic data, is provided by third-parties. As such, MyEListing will not be responsible for the accuracy of the information. It is strongly recommended that you verify all information with the listing agent, and any relevant agencies, prior to making any decisions.


