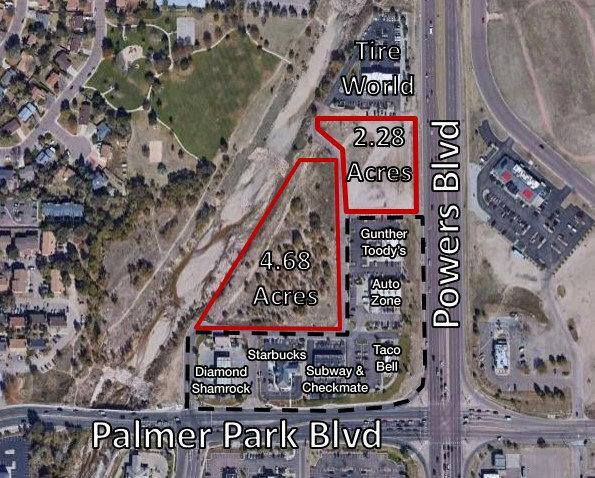
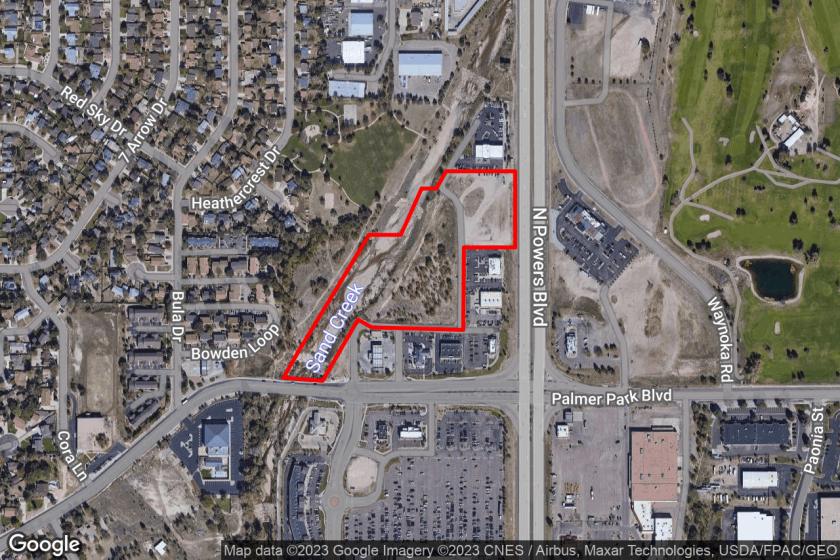
1-Mile | 3-Miles | 5-Miles | ||
---|---|---|---|---|
Total Population | 9,313 | 104,682 | 249,310 | |
Population Median Age | 37 | 35 | 36 | |
Population by Age | 0-9 Yrs | 1086 (11%) | 15016 (14%) | 34386 (13%) |
10-19 Yrs | 1191 (12%) | 13536 (12%) | 32340 (12%) | |
20-29 Yrs | 1561 (16%) | 19819 (18%) | 45858 (18%) | |
30-39 Yrs | 1680 (18%) | 16936 (16%) | 38726 (15%) | |
40-49 Yrs | 1016 (10%) | 11169 (10%) | 27279 (10%) | |
50-59 Yrs | 1130 (12%) | 11358 (10%) | 27671 (11%) | |
60-69 Yrs | 854 (9%) | 8985 (8%) | 22927 (9%) | |
70+ Yrs | 794 (8%) | 7864 (7%) | 20123 (8%) | |
Median HH Income | $62,619 | $61,768 | $61,823 | |
Total Household Income | < 24K | 466 (13%) | 6146 (15%) | 16447 (17%) |
25-49K | 883 (24%) | 9432 (23%) | 21866 (22%) | |
50-74K | 905 (25%) | 8523 (21%) | 19337 (20%) | |
75-99K | 606 (16%) | 5997 (15%) | 13899 (14%) | |
100-199K | 643 (17%) | 8513 (21%) | 20612 (21%) | |
200K+ | 77 (2%) | 943 (2%) | 3151 (3%) | |
Highest Education Level | No Diploma | 190 | 4515 | 12144 |
Diploma or GED | 1990 | 17044 | 38619 | |
Some College | 1785 | 18028 | 42901 | |
Assoc. Degree | 522 | 8306 | 18779 | |
Bachelors Degree | 1219 | 13302 | 32461 | |
Higher Degree | 517 | 6237 | 16757 | |
Total Housing Units | 3,690 | 40,896 | 99,524 | |
--Owner-Occupied | 2,705 | 24,281 | 56,671 | |
--Renter-Occupied | 875 | 15,273 | 38,642 | |
Owner-Occupied Values | < 100K | 175 | 1632 | 3482 |
100-199K | 674 | 5419 | 12464 | |
200-299K | 1083 | 11016 | 23722 | |
300-399K | 566 | 5162 | 12349 | |
400-499K | 115 | 567 | 3115 | |
500K+ | 93 | 484 | 1539 | |
Total Working Age Population | 7,473 | 81,360 | 195,018 | |
In Work Force | 5,348 | 56,921 | 134,308 | |
Not In Work Force | 2,125 | 24,439 | 60,710 | |
Workforce Employed | 4,826 | 50,195 | 119,895 | |
Workforce Unemployed | 292 | 3,345 | 7,993 | |
Civlian Workforce | 5,118 | 53,540 | 127,889 | |
Military Workforce | 230 | 3,381 | 6,419 | |
Total Households | 3,580 | 39,554 | 95,313 | |
Family Households | 2,439 | 26,530 | 61,344 | |
Non-Family Households | 1,141 | 13,024 | 33,969 | |
Married Couple | 1,663 | 18,446 | 43,740 | |
Other Family | 776 | 8,085 | 17,604 | |
Married w/Child | 645 | 7,729 | 17,995 | |
Single Male w/Child | 181 | 1,436 | 2,856 | |
Single Female w/Child | 240 | 2,969 | 6,713 |
Population Change Last Two Decades - Plus Projection
2000 | % | 2010 | % | 2020 | % | 2030 | |
---|---|---|---|---|---|---|---|
Colorado | 4,301,261 | +17 | 5,029,196 | +16 | 5,838,181 | +15 | 6,733,658 |
El Paso County | 516,929 | +20 | 622,263 | +18 | 735,176 | +16 | 855,206 |
Total Working Age Population:
Total Households:
Total Working Age Population:
Total Households:
Total Working Age Population:
Total Households: