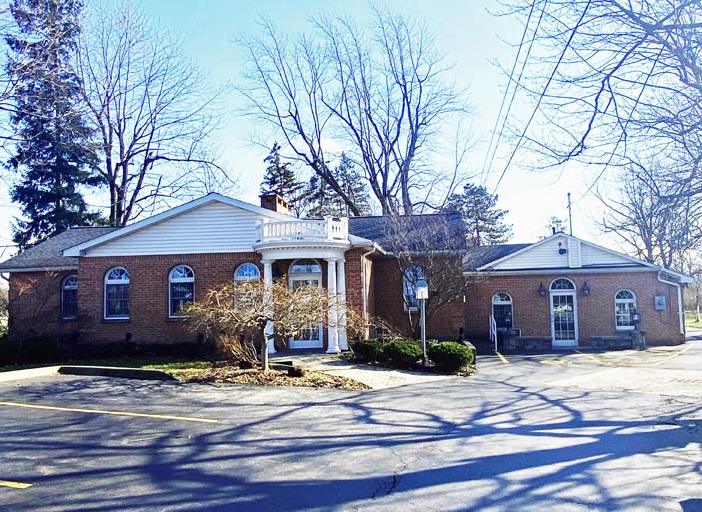
1-Mile | 3-Miles | 5-Miles | ||
---|---|---|---|---|
Total Population | 2,496 | 28,206 | 99,548 | |
Population Median Age | 45 | 43 | 43 | |
Population by Age | 0-9 Yrs | 215 (8%) | 3254 (11%) | 11057 (11%) |
10-19 Yrs | 188 (7%) | 3108 (11%) | 10870 (10%) | |
20-29 Yrs | 371 (14%) | 3236 (11%) | 10087 (10%) | |
30-39 Yrs | 285 (11%) | 3012 (10%) | 10975 (11%) | |
40-49 Yrs | 220 (8%) | 3045 (10%) | 11704 (11%) | |
50-59 Yrs | 451 (18%) | 4649 (16%) | 15522 (15%) | |
60-69 Yrs | 307 (12%) | 3531 (12%) | 13348 (13%) | |
70+ Yrs | 458 (18%) | 4372 (15%) | 15985 (16%) | |
Median HH Income | $80,985 | $91,153 | $80,791 | |
Total Household Income | < 24K | 153 (14%) | 1357 (11%) | 5862 (13%) |
25-49K | 148 (13%) | 1391 (11%) | 7220 (16%) | |
50-74K | 221 (20%) | 1996 (17%) | 7080 (16%) | |
75-99K | 91 (8%) | 1634 (14%) | 5753 (13%) | |
100-199K | 343 (31%) | 3441 (29%) | 11995 (27%) | |
200K+ | 131 (12%) | 1781 (15%) | 5080 (11%) | |
Highest Education Level | No Diploma | 39 | 568 | 2813 |
Diploma or GED | 435 | 4036 | 16733 | |
Some College | 353 | 3043 | 11236 | |
Assoc. Degree | 173 | 2385 | 7860 | |
Bachelors Degree | 483 | 5012 | 17125 | |
Higher Degree | 432 | 5433 | 16918 | |
Total Housing Units | 1,173 | 12,329 | 45,293 | |
--Owner-Occupied | 901 | 9,237 | 32,934 | |
--Renter-Occupied | 185 | 2,363 | 10,057 | |
Owner-Occupied Values | < 100K | 6 | 435 | 3282 |
100-199K | 326 | 2088 | 11066 | |
200-299K | 427 | 3481 | 8792 | |
300-399K | 43 | 1328 | 4721 | |
400-499K | 23 | 610 | 2209 | |
500K+ | 75 | 1296 | 2864 | |
Total Working Age Population | 2,168 | 23,199 | 81,904 | |
In Work Force | 1,473 | 14,921 | 52,100 | |
Not In Work Force | 695 | 8,278 | 29,804 | |
Workforce Employed | 1,378 | 14,375 | 50,228 | |
Workforce Unemployed | 95 | 528 | 1,805 | |
Civlian Workforce | 1,473 | 14,902 | 52,033 | |
Military Workforce | 0 | 19 | 67 | |
Total Households | 1,085 | 11,600 | 42,991 | |
Family Households | 696 | 7,647 | 26,776 | |
Non-Family Households | 389 | 3,953 | 16,214 | |
Married Couple | 610 | 6,532 | 21,724 | |
Other Family | 86 | 1,115 | 5,052 | |
Married w/Child | 172 | 2,682 | 8,347 | |
Single Male w/Child | 4 | 170 | 506 | |
Single Female w/Child | 11 | 275 | 1,588 |
Population Change Last Two Decades - Plus Projection
2000 | % | 2010 | % | 2020 | % | 2030 | |
---|---|---|---|---|---|---|---|
New York | 18,976,457 | +2 | 19,378,102 | +4 | 20,146,131 | +2 | 20,604,030 |
Erie County | 950,265 | -3 | 919,040 | +2 | 936,084 | +1 | 949,073 |
Total Working Age Population:
Total Households:
Total Working Age Population:
Total Households:
Total Working Age Population:
Total Households: