Commercial Land
6100 - 6120 Midway Rd Haltom City, TX 76117
6100 - 6120 Midway Rd Haltom City, TX 76117

Details & Description
Property Highlights
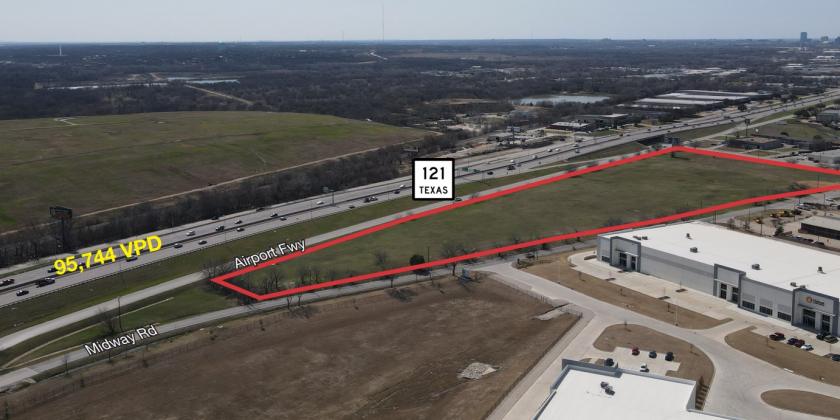
- • Highway 121 Frontage
- • High Traffic Count on Highway 121: 95,744 VPD
- • High Visibility
- • Zoning: M-1 Industrial
Listing Agents

Todd Hubbard
NAI Robert Lynn
O: 817-872-3901
M: 817-501-2012
thubbard@nairl.com
NAI Robert Lynn
O: 817-872-3901
M: 817-501-2012
thubbard@nairl.com

Joe McLiney
O: 817-872-3914
M: 816-718-4233
jmcliney@nairl.com
O: 817-872-3914
M: 816-718-4233
jmcliney@nairl.com
While we strive to provide the most accurate information, all listing information, and demographic data, is provided by third-parties. As such, MyEListing will not be responsible for the accuracy of the information. It is strongly recommended that you verify all information with the listing agent, and any relevant agencies, prior to making any decisions.