Retail Space
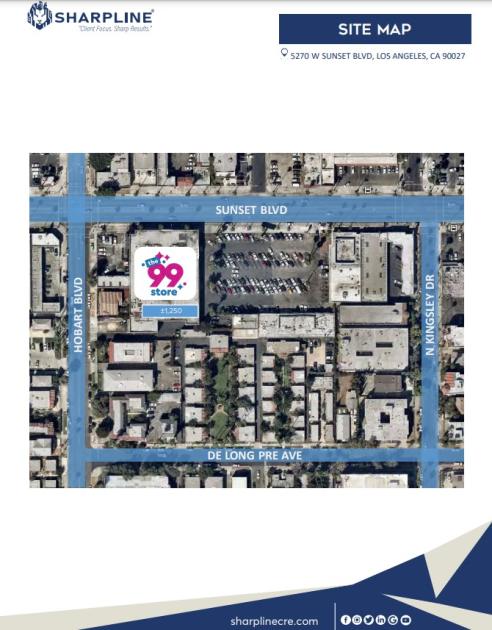
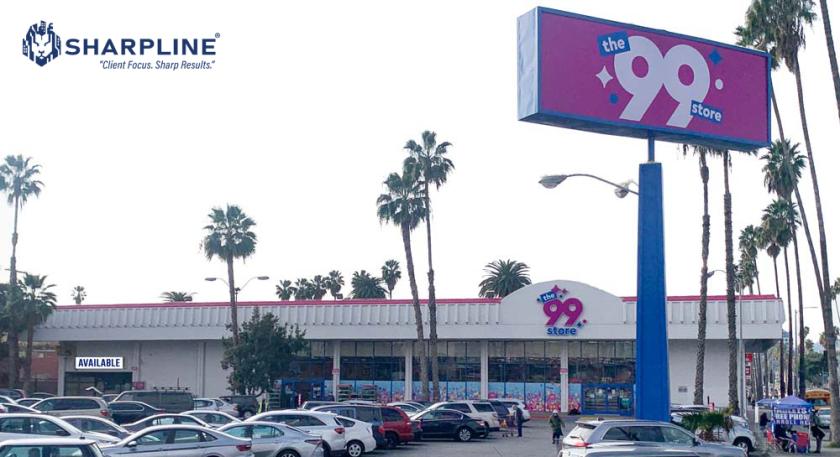
5270 Sunset Boulevard Los Angeles, CA 90027
5270 Sunset Boulevard Los Angeles, CA 90027
Details & Description
Property Highlights
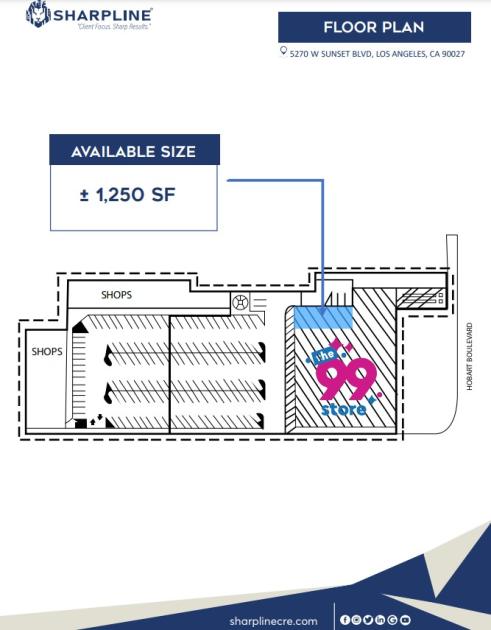
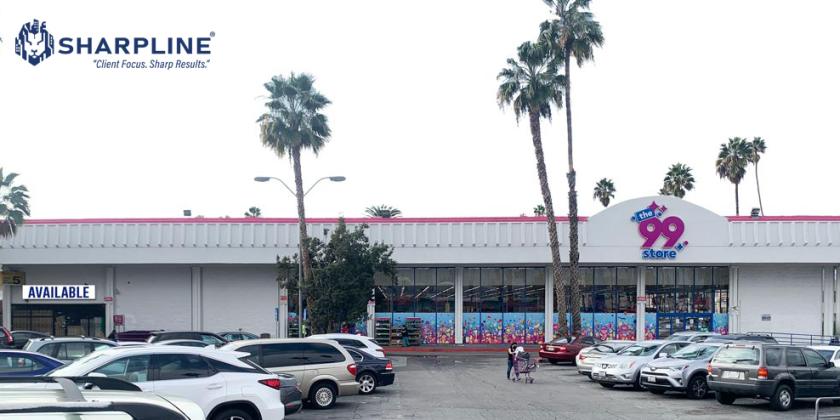
- • ±1,250 SF retail space for sublease
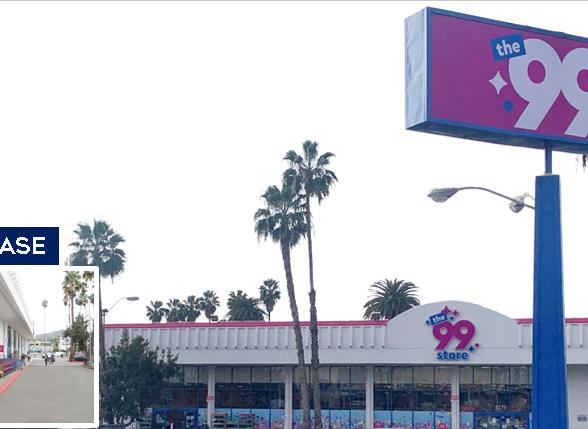
- • Adjacent to a busy 99 Cents Only Stores
- • Over 40,000 CPD at Sunset Blvd. and Harvard Blvd
Additional Photos


Listing Agents

Barbara Armendariz
O: 213-266-3333
contactus@sharplinecre.com
O: 213-266-3333
contactus@sharplinecre.com
While we strive to provide the most accurate information, all listing information, and demographic data, is provided by third-parties. As such, MyEListing will not be responsible for the accuracy of the information. It is strongly recommended that you verify all information with the listing agent, and any relevant agencies, prior to making any decisions.