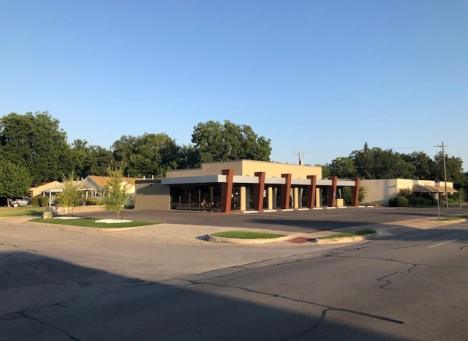
Retail Space
4551 James Avenue Fort Worth, TX 76115
4551 James Avenue Fort Worth, TX 76115
Details & Description
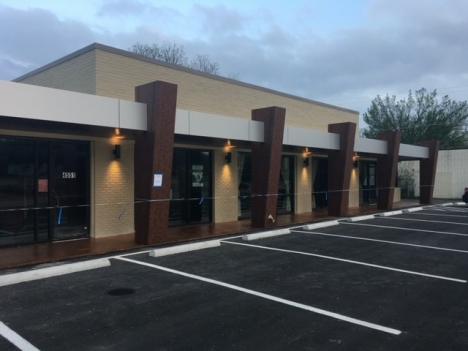
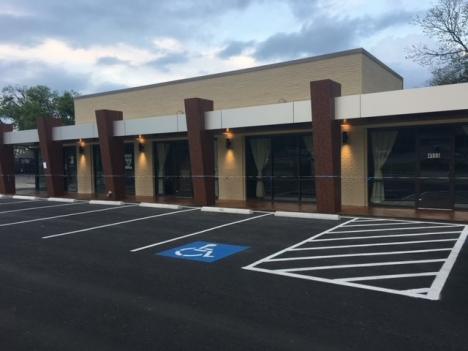
Additional Photos


Listing Agents

Monika Guzman
O: 817-872-3913
M: 214-215-2101
mguzman@nairl.com
O: 817-872-3913
M: 214-215-2101
mguzman@nairl.com

Logan May
O: 817-872-3909
M: 325-642-4312
lmay@nairl.com
O: 817-872-3909
M: 325-642-4312
lmay@nairl.com
While we strive to provide the most accurate information, all listing information, and demographic data, is provided by third-parties. As such, MyEListing will not be responsible for the accuracy of the information. It is strongly recommended that you verify all information with the listing agent, and any relevant agencies, prior to making any decisions.


