Office Space
8233 Mid Cities Boulevard North Richland Hills, TX 76182
8233 Mid Cities Boulevard North Richland Hills, TX 76182

Details & Description
Property Highlights
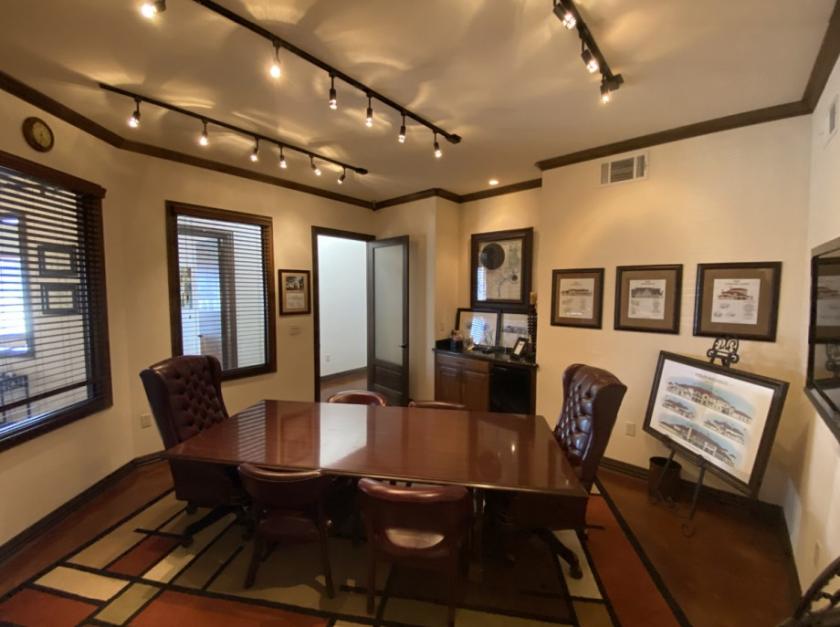
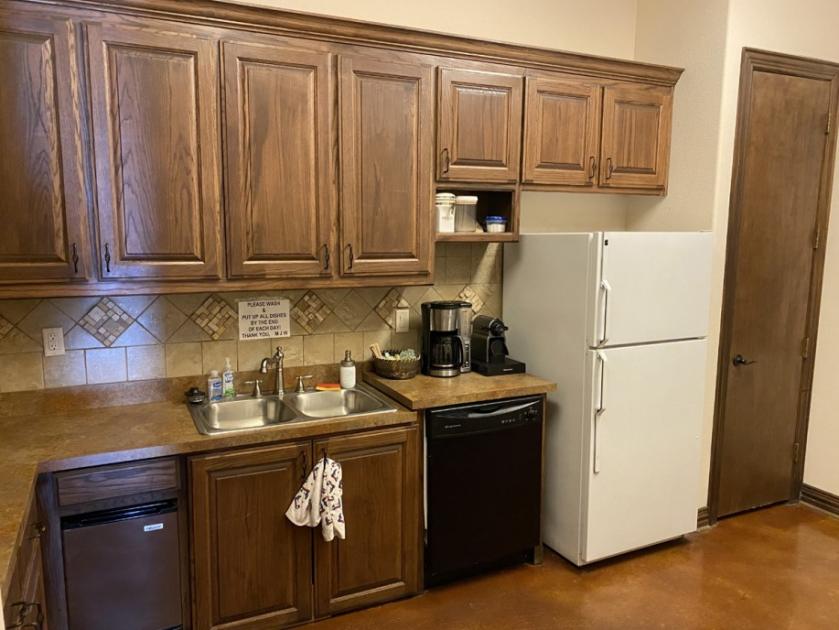
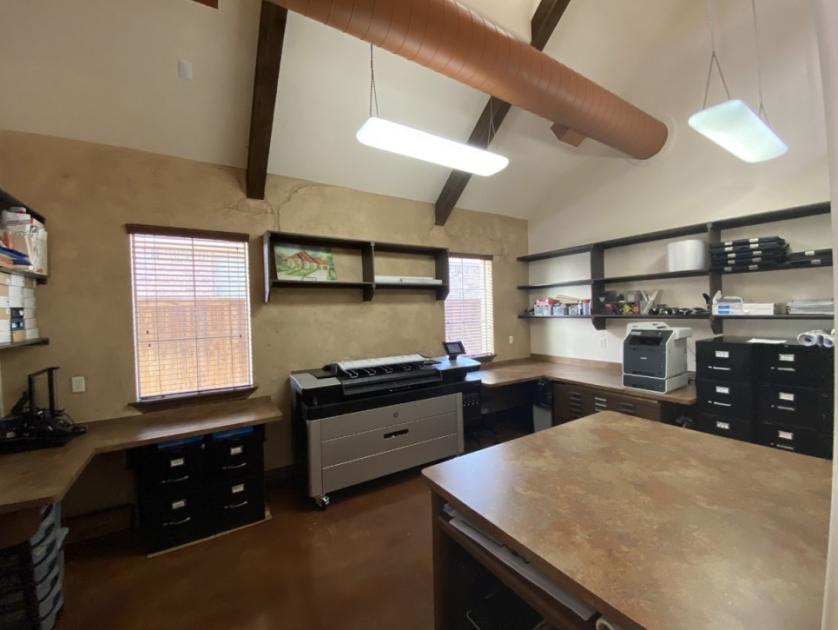
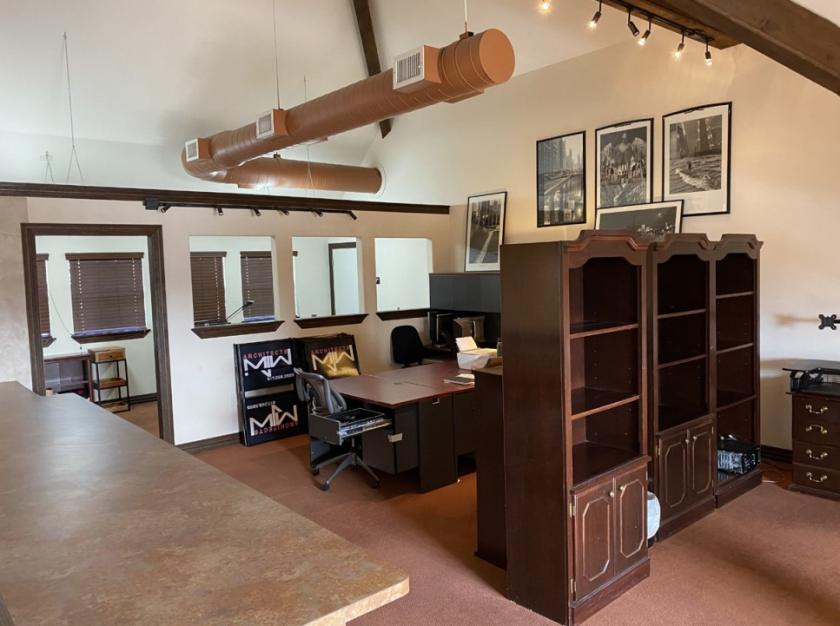
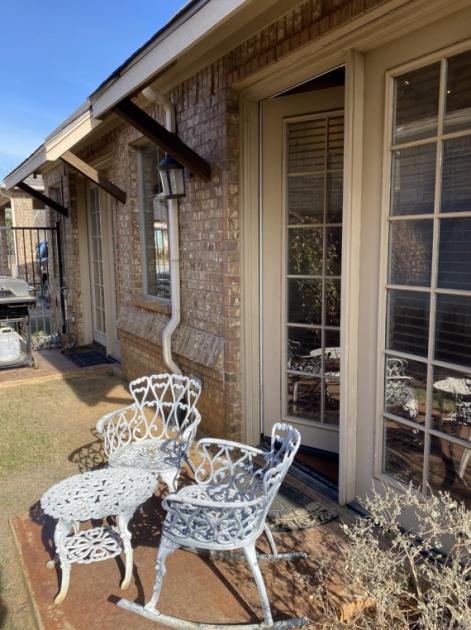
- • Beautiful Move-In Ready Office
- • Over-the-Top Interior Finishes
- • Great Location
- • Tall Ceilings
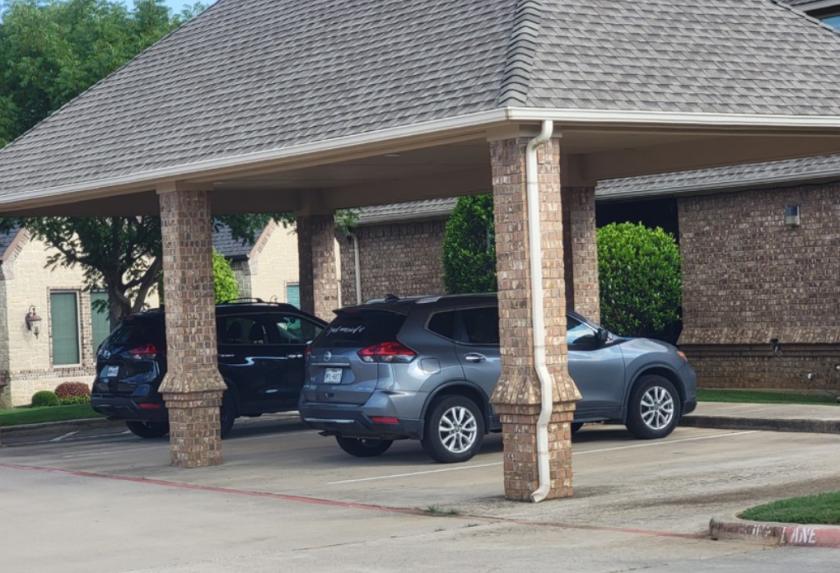
- • Covered Carport Parking
Additional Photos


Listing Agents

Logan May
O: 817-872-3909
M: 325-642-4312
lmay@nairl.com
O: 817-872-3909
M: 325-642-4312
lmay@nairl.com
While we strive to provide the most accurate information, all listing information, and demographic data, is provided by third-parties. As such, MyEListing will not be responsible for the accuracy of the information. It is strongly recommended that you verify all information with the listing agent, and any relevant agencies, prior to making any decisions.