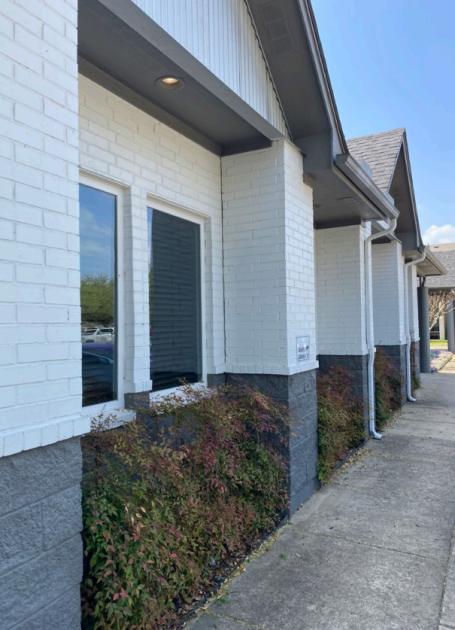
Office Space
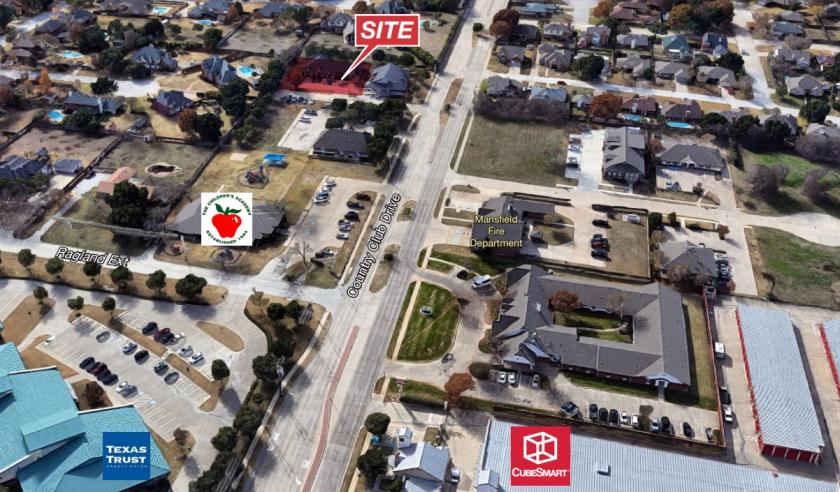
1696 Country Club Drive Mansfield, TX 76063
1696 Country Club Drive Mansfield, TX 76063

Details & Description
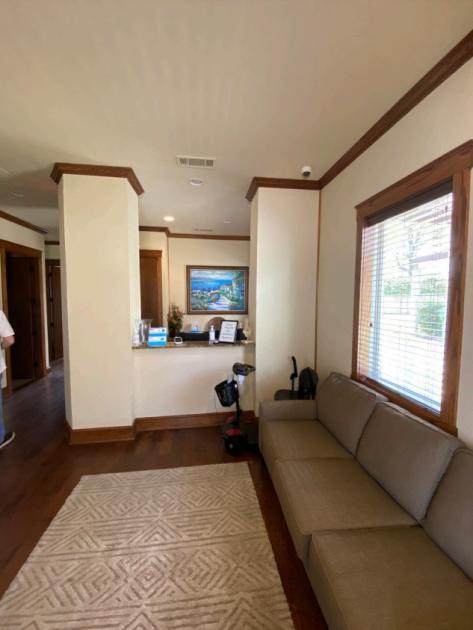
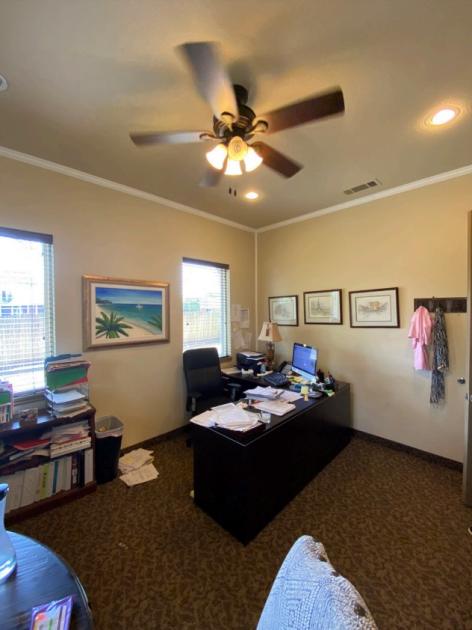
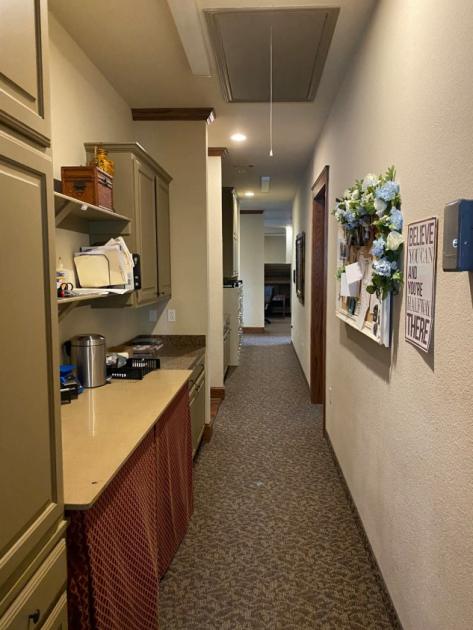
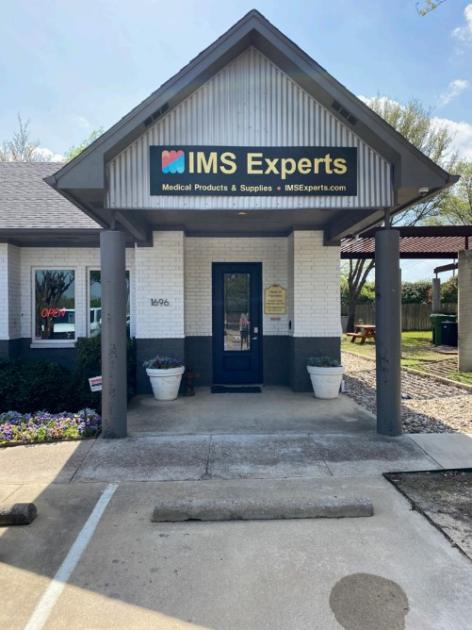
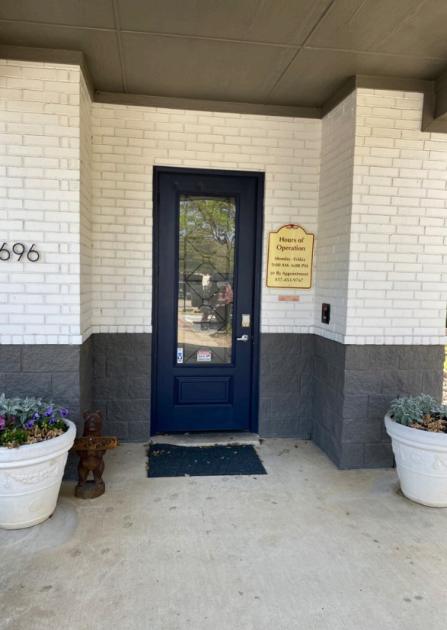
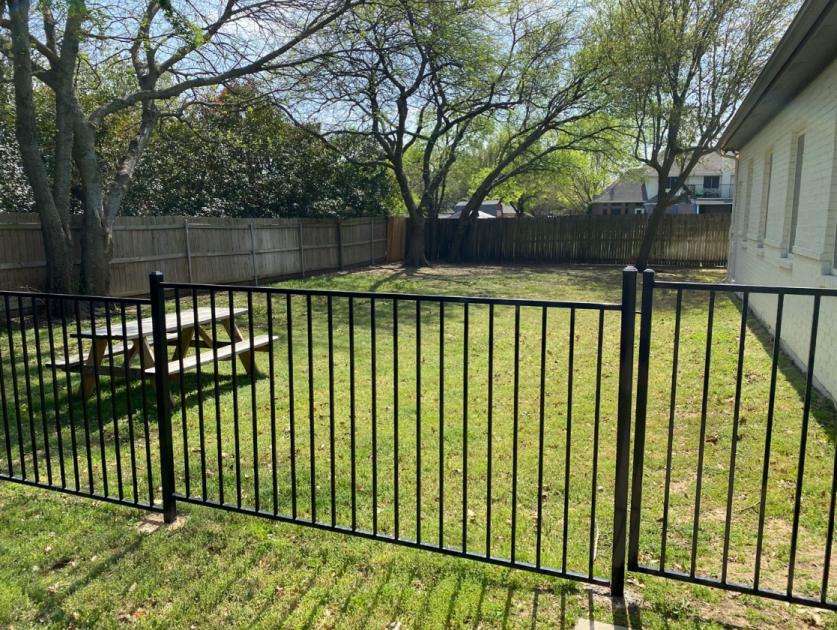
Additional Photos
Listing Agents

Chase Miller
O: 214-256-7131
M: 214-770-5495
cmiller@nairl.com
O: 214-256-7131
M: 214-770-5495
cmiller@nairl.com
While we strive to provide the most accurate information, all listing information, and demographic data, is provided by third-parties. As such, MyEListing will not be responsible for the accuracy of the information. It is strongly recommended that you verify all information with the listing agent, and any relevant agencies, prior to making any decisions.