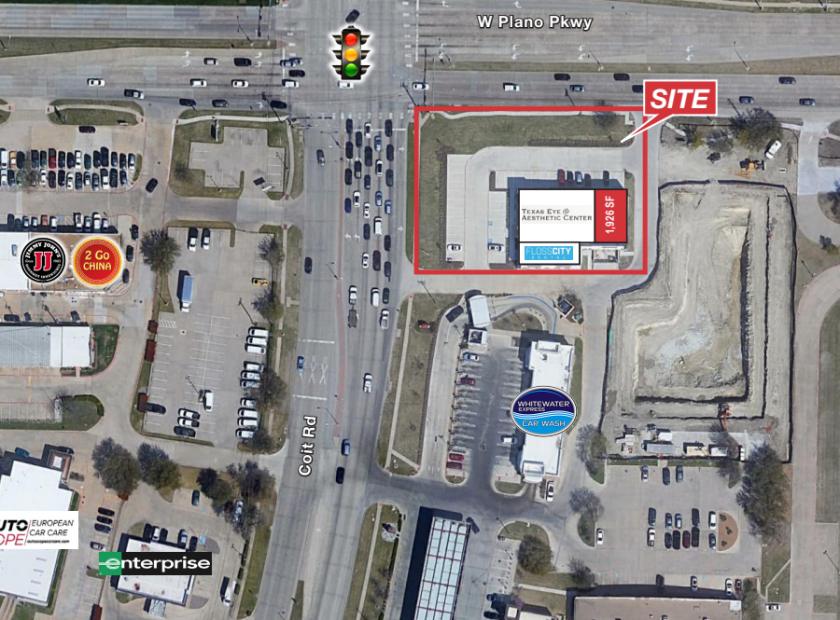
Retail Space
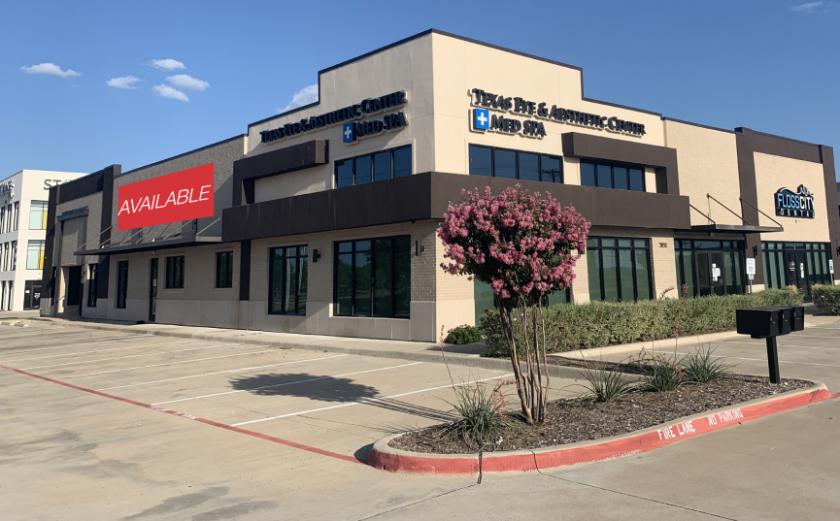
3950 West Plano Parkway Plano, TX 75075
3950 West Plano Parkway Plano, TX 75075
Details & Description
Property Highlights
- • Suite 103
- • New Construction Medical/Retail Site Available
- • High End Demographics
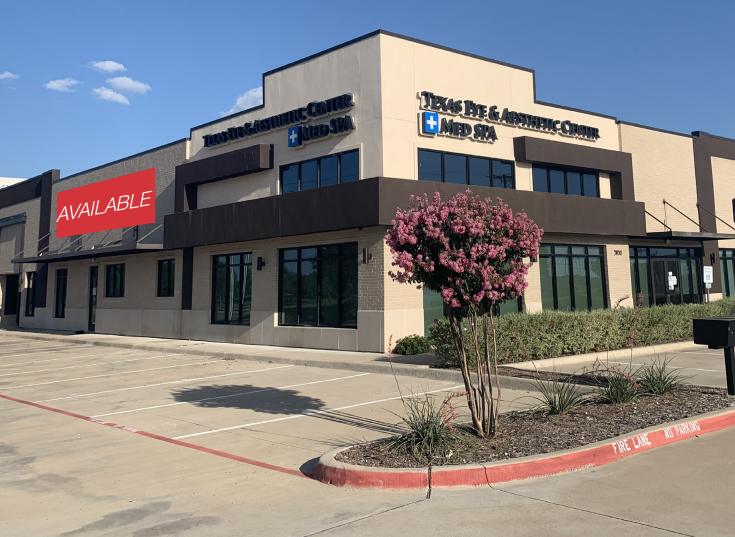
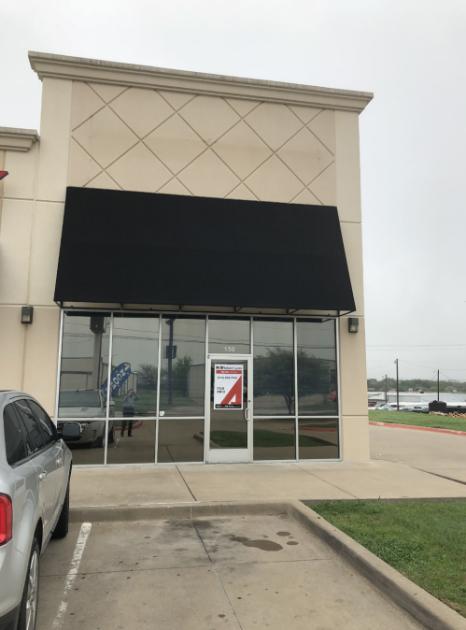
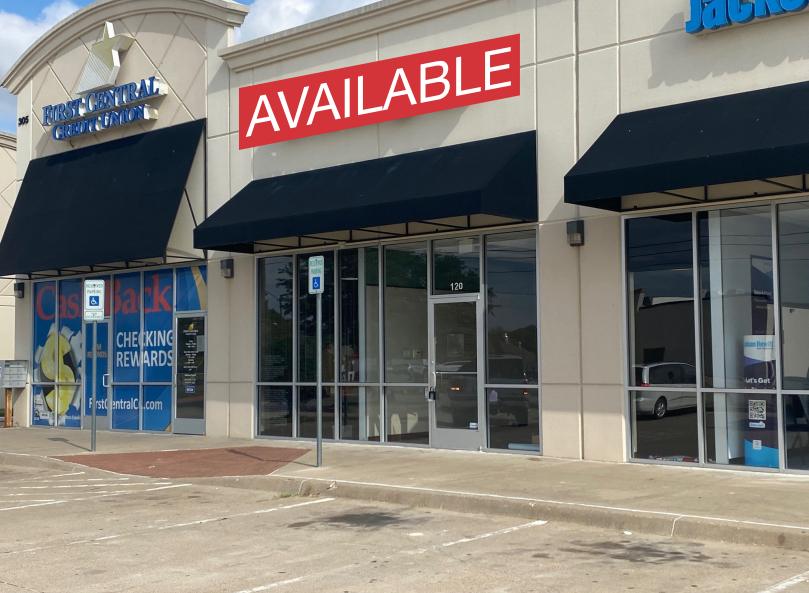
Additional Photos

Listing Agents

Josh Mann
O: 214-256-7100
M: 972-971-8336
jmann@nairl.com
O: 214-256-7100
M: 972-971-8336
jmann@nairl.com

Luke Kelley
O: 214-256-7168
M: 214-588-0147
lkelley@nairl.com
O: 214-256-7168
M: 214-588-0147
lkelley@nairl.com
While we strive to provide the most accurate information, all listing information, and demographic data, is provided by third-parties. As such, MyEListing will not be responsible for the accuracy of the information. It is strongly recommended that you verify all information with the listing agent, and any relevant agencies, prior to making any decisions.