Commercial Land
Alabaster Land Alabaster, AL 35007
Alabaster Land Alabaster, AL 35007

Details & Description
Property Highlights
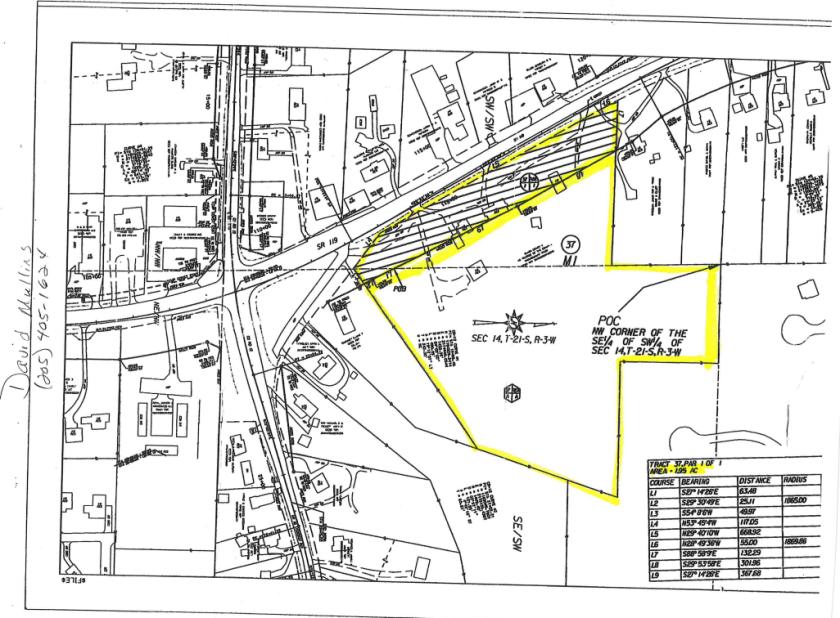
- • Zoned B-3 / Alabaster
- • Over 750 feet of frontage on Hwy 119
- • Across from Church of the Highlands
Listing Agents

Keith Arendall
O: 205-910-8096
Karendall@lahrealestate.com
O: 205-910-8096
Karendall@lahrealestate.com
While we strive to provide the most accurate information, all listing information, and demographic data, is provided by third-parties. As such, MyEListing will not be responsible for the accuracy of the information. It is strongly recommended that you verify all information with the listing agent, and any relevant agencies, prior to making any decisions.