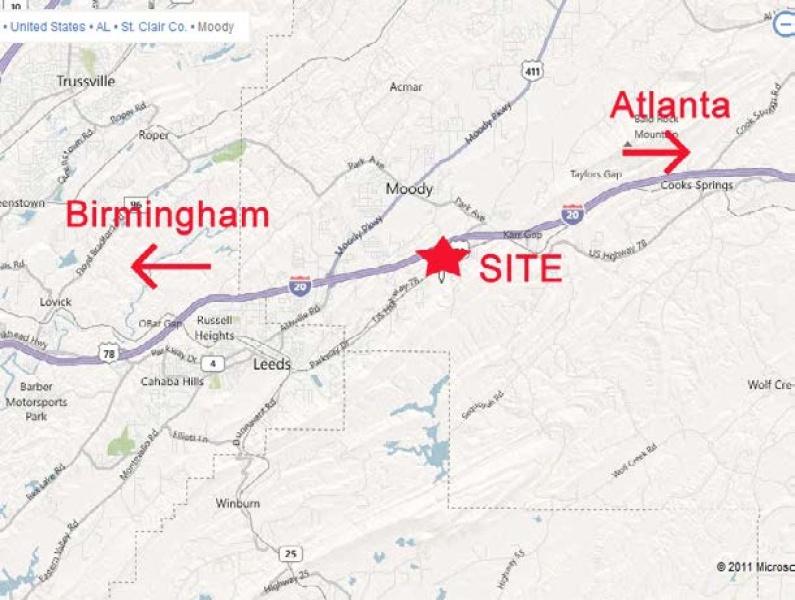
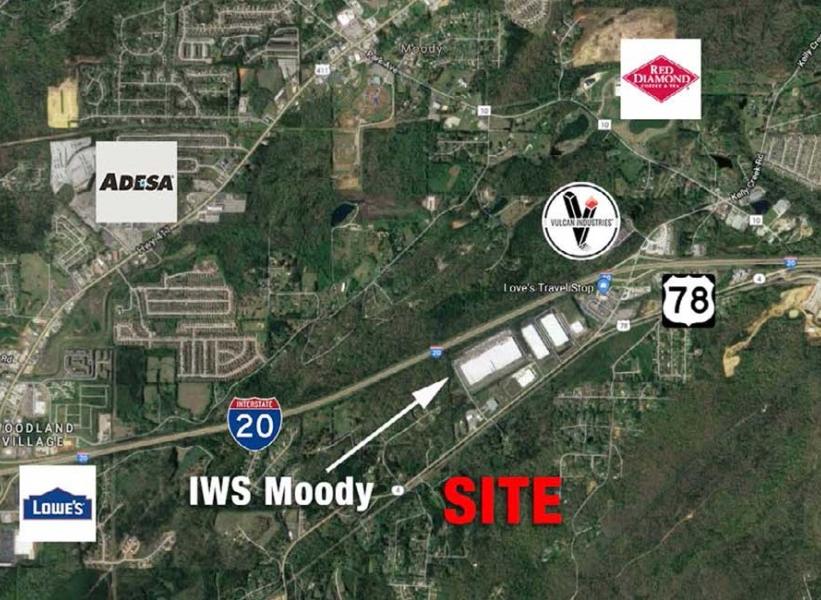
1-Mile | 3-Miles | 5-Miles | ||
---|---|---|---|---|
Total Population | 1,359 | 13,233 | 25,338 | |
Population Median Age | 37 | 39 | 39 | |
Population by Age | 0-9 Yrs | 171 (12%) | 1694 (12%) | 3419 (13%) |
10-19 Yrs | 186 (13%) | 1693 (12%) | 3142 (12%) | |
20-29 Yrs | 248 (18%) | 1687 (12%) | 2884 (11%) | |
30-39 Yrs | 136 (10%) | 1842 (13%) | 3656 (14%) | |
40-49 Yrs | 174 (12%) | 1624 (12%) | 3283 (12%) | |
50-59 Yrs | 175 (12%) | 1933 (14%) | 3566 (14%) | |
60-69 Yrs | 125 (9%) | 1452 (10%) | 2847 (11%) | |
70+ Yrs | 143 (10%) | 1308 (9%) | 2541 (10%) | |
Median HH Income | $54,339 | $61,327 | $61,240 | |
Total Household Income | < 24K | 95 (18%) | 818 (15%) | 1553 (16%) |
25-49K | 145 (28%) | 1199 (23%) | 2037 (21%) | |
50-74K | 102 (19%) | 1185 (23%) | 2188 (23%) | |
75-99K | 61 (11%) | 662 (12%) | 1360 (14%) | |
100-199K | 100 (19%) | 1216 (23%) | 2161 (22%) | |
200K+ | 14 (2%) | 62 (1%) | 181 (1%) | |
Highest Education Level | No Diploma | 105 | 710 | 1747 |
Diploma or GED | 296 | 3133 | 6068 | |
Some College | 218 | 2502 | 4504 | |
Assoc. Degree | 120 | 1006 | 1675 | |
Bachelors Degree | 142 | 1315 | 2483 | |
Higher Degree | 29 | 507 | 1080 | |
Total Housing Units | 553 | 5,458 | 10,495 | |
--Owner-Occupied | 360 | 3,956 | 7,419 | |
--Renter-Occupied | 156 | 1,186 | 2,060 | |
Owner-Occupied Values | < 100K | 86 | 674 | 1653 |
100-199K | 163 | 2258 | 3466 | |
200-299K | 94 | 791 | 1629 | |
300-399K | 7 | 102 | 341 | |
400-499K | 6 | 82 | 152 | |
500K+ | 5 | 51 | 179 | |
Total Working Age Population | 1,025 | 10,220 | 19,652 | |
In Work Force | 623 | 6,743 | 12,852 | |
Not In Work Force | 402 | 3,478 | 6,800 | |
Workforce Employed | 580 | 6,385 | 12,329 | |
Workforce Unemployed | 31 | 326 | 491 | |
Civlian Workforce | 611 | 6,711 | 12,820 | |
Military Workforce | 12 | 32 | 32 | |
Total Households | 516 | 5,142 | 9,479 | |
Family Households | 369 | 3,636 | 6,837 | |
Non-Family Households | 147 | 1,506 | 2,642 | |
Married Couple | 240 | 2,723 | 5,074 | |
Other Family | 129 | 913 | 1,763 | |
Married w/Child | 111 | 1,207 | 2,302 | |
Single Male w/Child | 19 | 102 | 209 | |
Single Female w/Child | 49 | 351 | 627 |
Population Change Last Two Decades - Plus Projection
2000 | % | 2010 | % | 2020 | % | 2030 | |
---|---|---|---|---|---|---|---|
Alabama | 4,447,100 | +7 | 4,779,736 | +3 | 4,940,253 | +4 | 5,124,380 |
St. Clair County | 64,742 | +29 | 83,593 | +8 | 90,634 | +11 | 100,206 |
Shelby County | 143,293 | +36 | 195,085 | +15 | 224,628 | +13 | 253,485 |
Jefferson County | 662,047 | -1 | 658,466 | +1 | 662,458 | 0 | 665,244 |
Total Working Age Population:
Total Households:
Total Working Age Population:
Total Households:
Total Working Age Population:
Total Households: