Commercial Land
2642 Greens Road Houston, TX 77032
2642 Greens Road Houston, TX 77032

Details & Description
Property Highlights
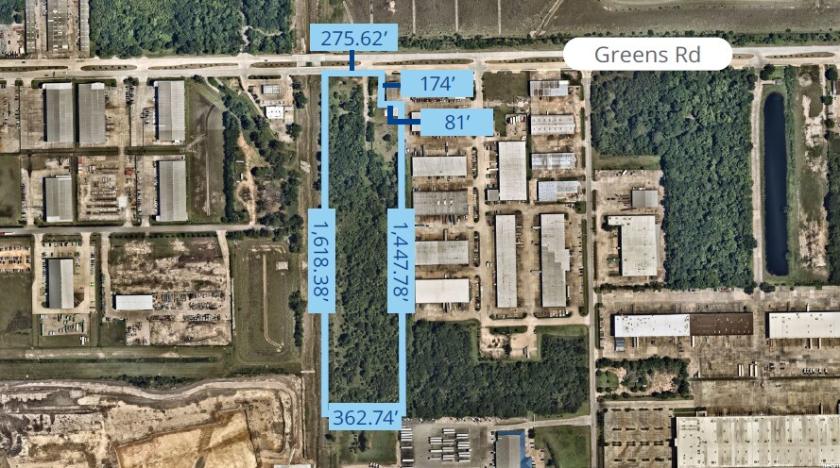
- • ±13.0412 Acres
- • Unrestricted
- • City of Houston utilities
- • Detention/Engineering required
- • Proximity to Bush IAH and air freight
- • Rectangular shape, excellent development site
Additional Photos


Listing Agents

Wes Williams
O: 713-830-2113
M: 281-636-9535
wes.williams@colliers.com
O: 713-830-2113
M: 281-636-9535
wes.williams@colliers.com
While we strive to provide the most accurate information, all listing information, and demographic data, is provided by third-parties. As such, MyEListing will not be responsible for the accuracy of the information. It is strongly recommended that you verify all information with the listing agent, and any relevant agencies, prior to making any decisions.


