Commercial Land
16046 North Arrowhead Fountains Center Drive Peoria, AZ 85382
16046 North Arrowhead Fountains Center Drive Peoria, AZ 85382
Details & Description
Property Highlights
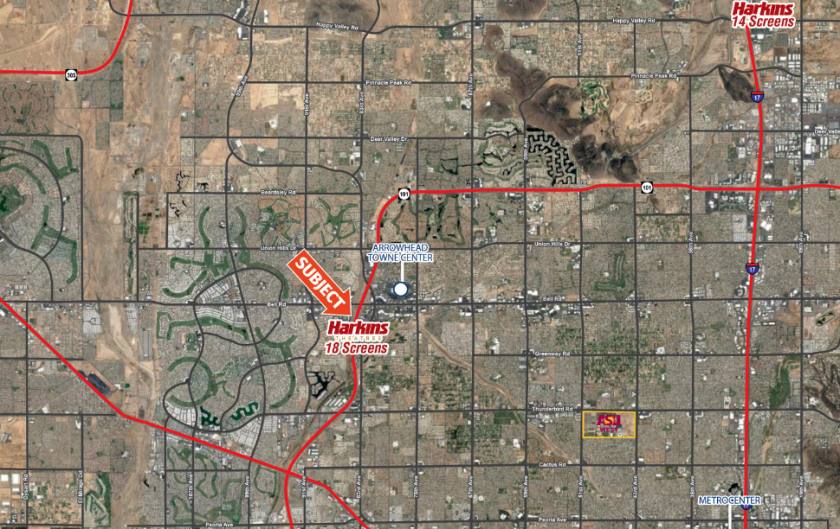
• Traffic Count: 114,328 on AZ-Loop 101 on & 70,000 on Bell Rd
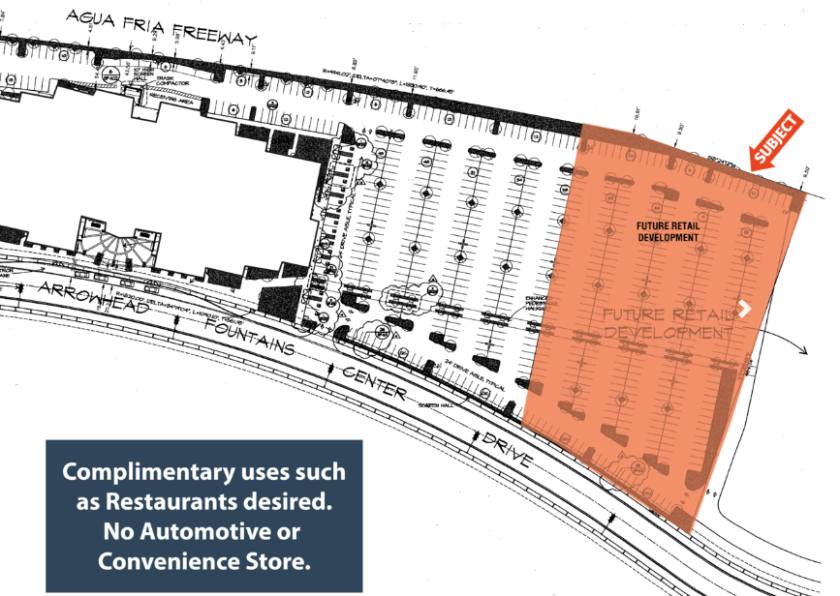
• Rare pad opportunity in Arrowhead
Additional Photos

Listing Agents

Eric Termansen
O: 602-778-3745
etermansen@w-retail.com
O: 602-778-3745
etermansen@w-retail.com

Ryan Desmond
O: 602-931-4489
rdesmond@w-retail.com
O: 602-931-4489
rdesmond@w-retail.com
While we strive to provide the most accurate information, all listing information, and demographic data, is provided by third-parties. As such, MyEListing will not be responsible for the accuracy of the information. It is strongly recommended that you verify all information with the listing agent, and any relevant agencies, prior to making any decisions.


