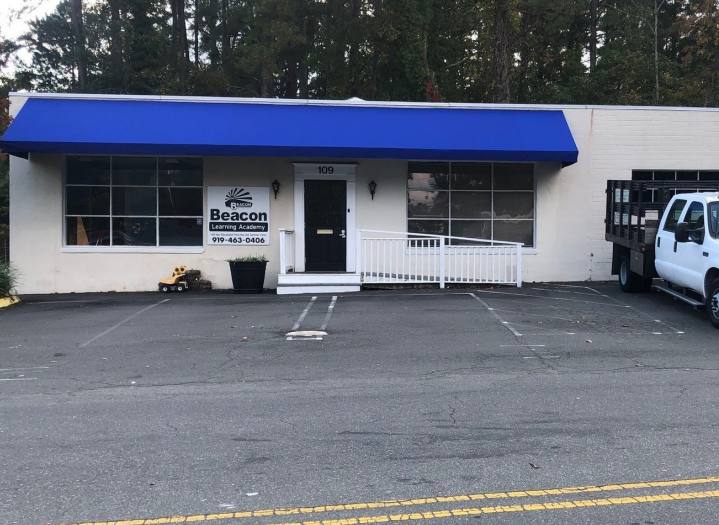
Retail Space
109 Ward Street Cary, NC 27511
109 Ward Street Cary, NC 27511
Details & Description
Property Highlights
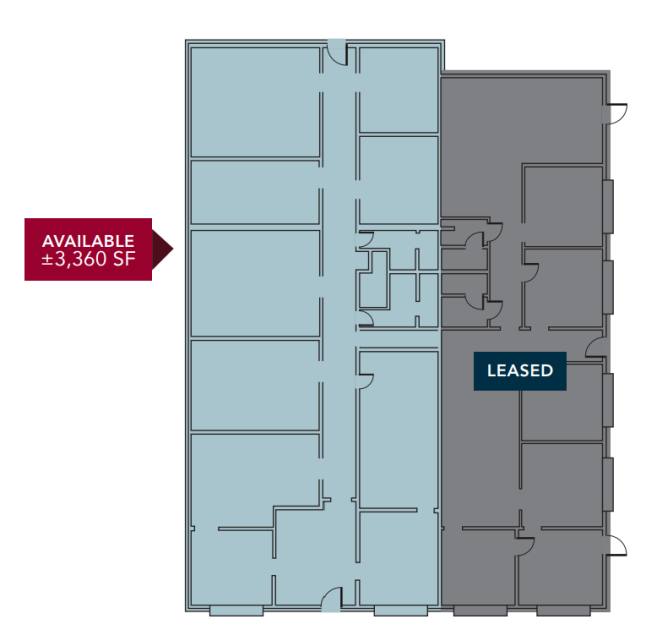
- • Ideal for office or general retail
- • Fenced yard area included
- • Currently vacant
- • 0.44 acres
- • Built 1961
- • 14 parking spaces
Listing Agents

Stone Alexander
O: 919-591-2275
M: 919-600-2397
salexander@lee-associates.com
O: 919-591-2275
M: 919-600-2397
salexander@lee-associates.com
While we strive to provide the most accurate information, all listing information, and demographic data, is provided by third-parties. As such, MyEListing will not be responsible for the accuracy of the information. It is strongly recommended that you verify all information with the listing agent, and any relevant agencies, prior to making any decisions.