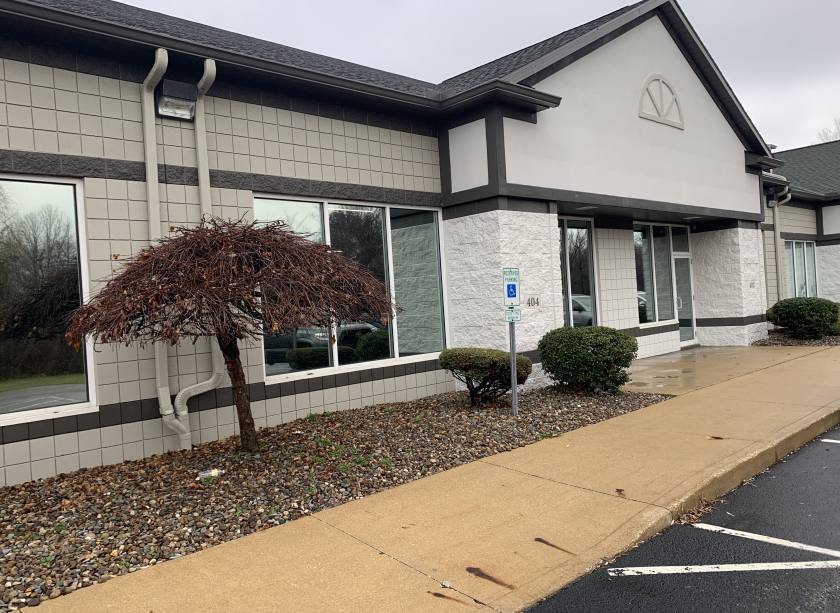
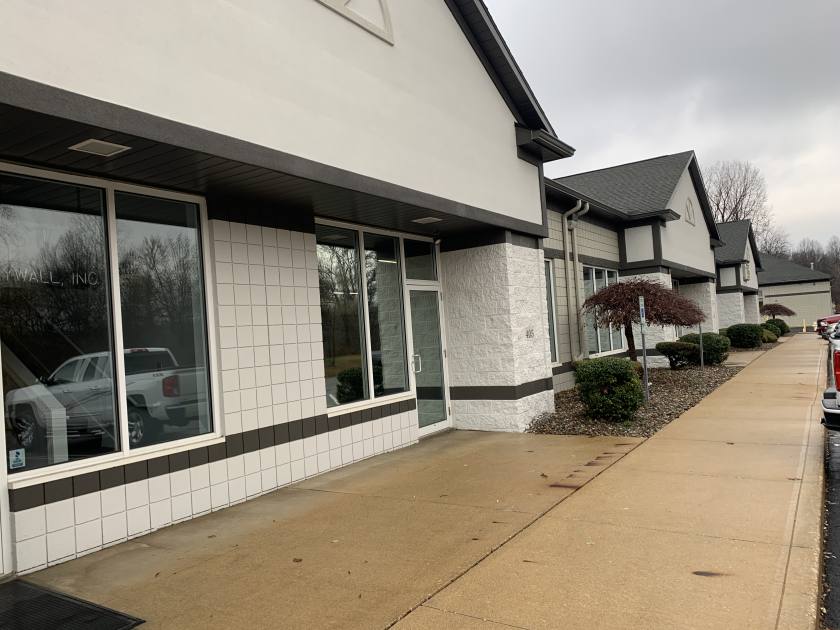
Retail Space
2215 East Waterloo Road Akron, OH 44312
2215 East Waterloo Road Akron, OH 44312
Details & Description
Property Highlights
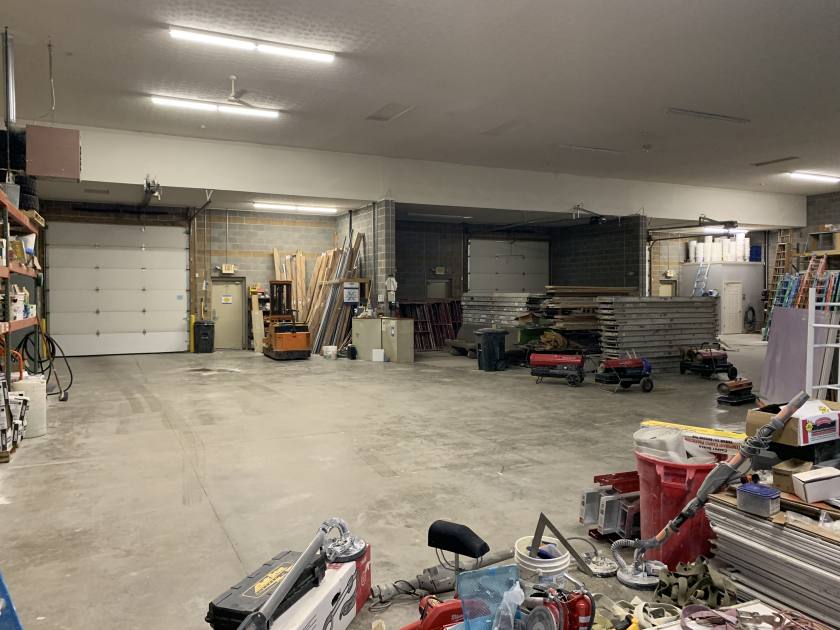
- • Warehouse Space 2,100 SF
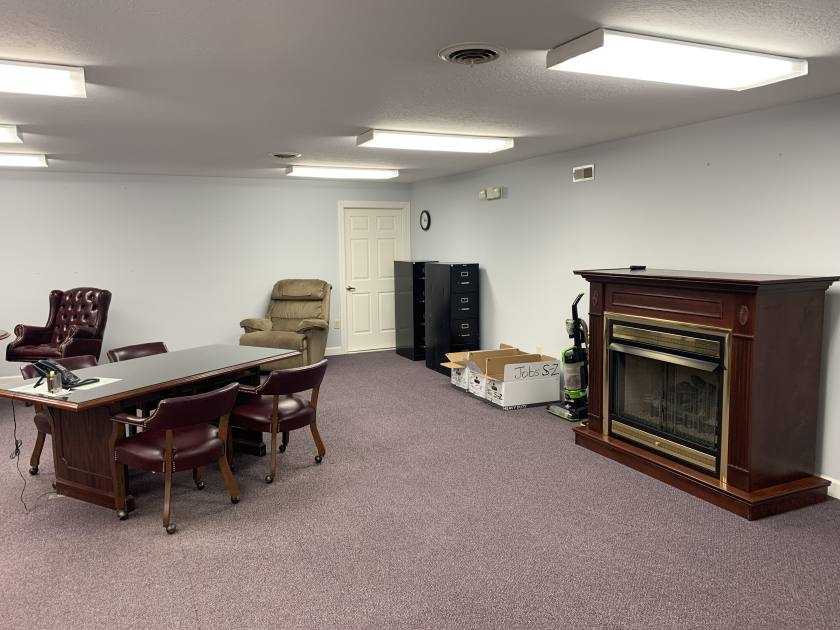
- • Office Space 3,300 SF
- • 1 Drive-In Door
- • Light industrial allowed
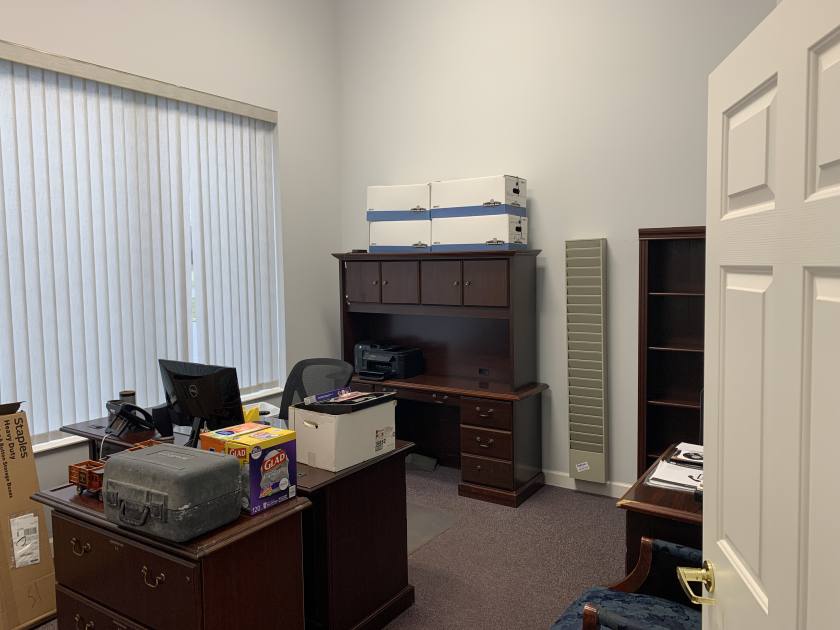
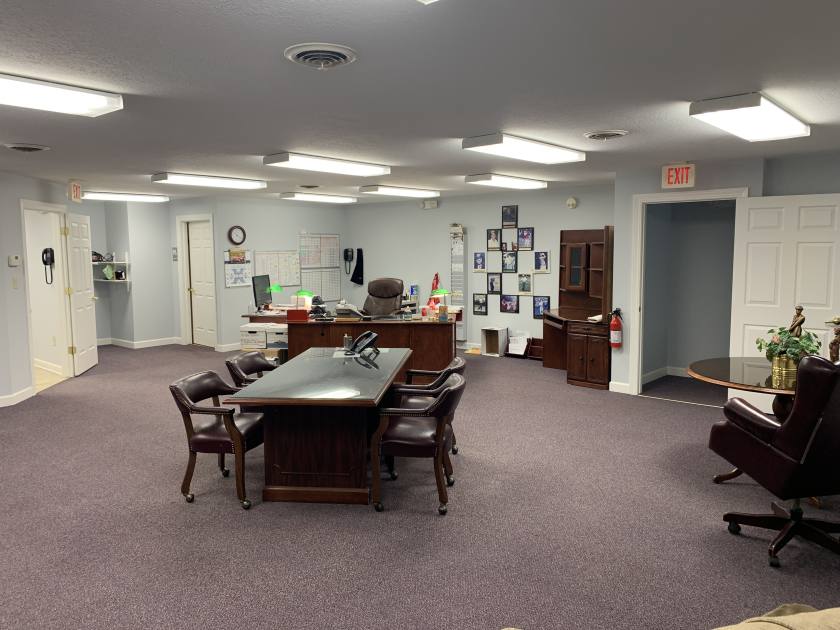
Additional Photos

Listing Agents

David Whyte
O: 330-535-2661
M: 303-352-7746
dwhyte@naipvc.com
O: 330-535-2661
M: 303-352-7746
dwhyte@naipvc.com

Karen Whyte
O: 330-535-2661
M: 330-351-1757
karen.whyte@naipvc.com
O: 330-535-2661
M: 330-351-1757
karen.whyte@naipvc.com
While we strive to provide the most accurate information, all listing information, and demographic data, is provided by third-parties. As such, MyEListing will not be responsible for the accuracy of the information. It is strongly recommended that you verify all information with the listing agent, and any relevant agencies, prior to making any decisions.