Commercial Land
221 N. Division Street Plainfield, IL 60544
221 N. Division Street Plainfield, IL 60544
Details & Description
Property Highlights
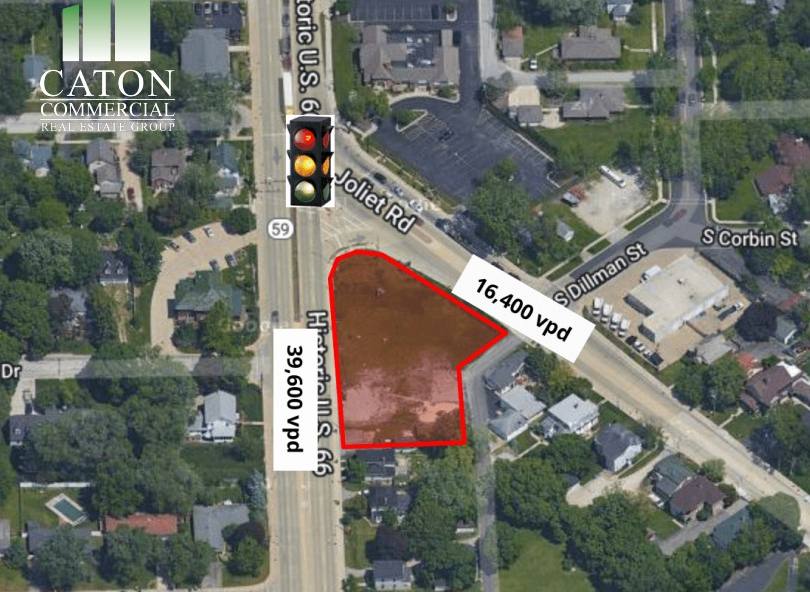
• Traffic on Route 59 is 39,600 VPD an 16,400 VPD on Route 30 (Joliet Street)
• APNs: 06-03-15-108-001, 06-03-15-108-002, 06-03-15-108-003, and 06-03-15-108-004
Listing Agents

Brian Blackmore
O: 815-436-5700
M: 630-207-8292
brian@catoncommercial.com
O: 815-436-5700
M: 630-207-8292
brian@catoncommercial.com
While we strive to provide the most accurate information, all listing information, and demographic data, is provided by third-parties. As such, MyEListing will not be responsible for the accuracy of the information. It is strongly recommended that you verify all information with the listing agent, and any relevant agencies, prior to making any decisions.


